


 FxWirePro- Major Pair levels and bias summary
  FxWirePro- Woodies Pivot(Major)
  FxWirePro: EUR/AUD gaining momentum for a move towards 1.6800 level
  EUR/JPY Bulls Charge: Eyeing 186.00 as Euro Strength Intensifies
  FxWirePro: USD/ZAR fibo rejection triggers sizeable pullback
  FxWirePro- Major European Indices
  FxWirePro- Major Crypto levels and bias summary
  FxWirePro: USD/ZAR sustains gains as uptrend remains strong
  FxWirePro: GBP/NZD range to extend until there is game changing news
  FxWirePro: EUR/ NZD steadies around 2.0150, retains bid tone
  FxWirePro: USD/JPY firms as Trump's address on Gulf war spark fresh concerns
  FxWirePro: GBP/USD recovers but bears are not done yet again
  Ethereum Retreats Toward USD 2,000: Technicals Signal Caution as ETH Mimics Bitcoin’s Pullback
  FxWirePro: AUD/USD downside pressure builds, key support level in focus
  Pound Under Pressure as Yen Stabilizes: GBPJPY Bears Target 208 as Key EMAs Hold Resistance


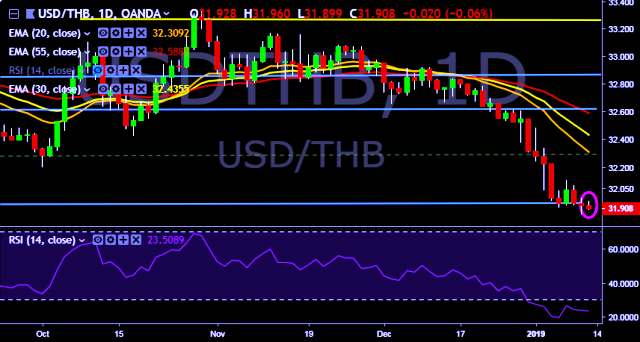
- USD/THB is currently trading around 31.91 marks.
- It made intraday high at 31.96 and low at 31.89 marks.
- Intraday bias remains bearish for the moment.
- On the top side, key resistances are seen at 32.02, 32.10, 32.22, 32.48, 32.70, 32.83 and 32.92 marks respectively.
- Alternatively, a daily close below 31.92 will drag the parity down towards key supports around 31.85, 31.60 and 31.24 marks respectively.
- Important to note here that 20D, 30D and 55D EMA heads down and confirms the bearish trend in a daily chart.
We prefer to take short position on USD/THB around 31.92, stop loss at 32.10 and target of 31.60.


