


 FxWirePro: EUR/AUD gaining momentum for a move towards 1.6800 level
  FxWirePro: GBP/NZD remains buoyant, looks to extend gains
  NZDJPY Bears Take Control: New Zealand Dollar Retreats as 92 Resistance Holds Firm
  EUR/JPY Bulls Charge: Eyeing 186.00 as Euro Strength Intensifies
  Pound Under Pressure as Yen Stabilizes: GBPJPY Bears Target 208 as Key EMAs Hold Resistance
  FxWirePro- Major European Indices
  Aussie Retreats Against the Yen: AUDJPY Bears Target 108 as 110 Resistance Holds Firm
  Ethereum Retreats Toward USD 2,000: Technicals Signal Caution as ETH Mimics Bitcoin’s Pullback
  FxWirePro:NZD/USD drifts lower, could be on verge of bigger drop
  FxWirePro- Major Crypto levels and bias summary
  FxWirePro- Major Pair levels and bias summary
  FxWirePro: EUR/AUD eases slightly but trend is still bullish
  FxWirePro: USD/CAD runs out of steam but maintains bullish outlook
  FxWirePro: USD/ZAR sustains gains as uptrend remains strong
  FxWirePro- Woodies Pivot(Major)


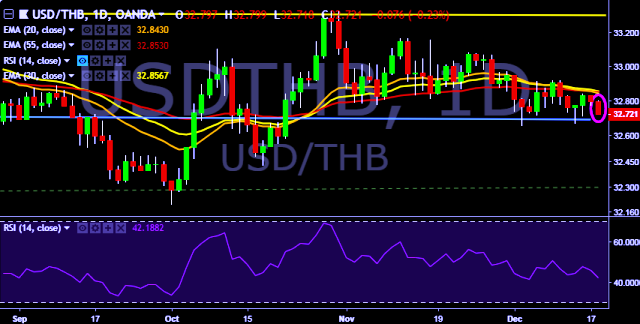
- USD/THB is currently trading around 32.72 marks.
- It made intraday high at 32.79 and low at 32.71 marks.
- Intraday bias remains bearish till the time pair holds immediate resistance at 32.83 mark.
- On the top side, key resistances are seen at 32.83, 32.92, 33.07, 33.15, 33.32 and 33.52 marks respectively.
- Alternatively, a daily close below 32.73 will drag the parity down towards key supports around 32.65, 32.57, 32.42, 32.20 and 32.07 marks respectively.
- Important to note here that 20D, 30D and 55D EMA heads down and confirms the bearish trend in a daily chart.
We prefer to take short position on USD/THB around 32.75, stop loss at 32.83 and target of 32.72/32.57/32.42.


