


 Euro Ascendant: EUR/USD Breaks $1.17 as Geopolitical Relief Sparks a Bullish Surge
  FxWirePro: EUR/ NZD downside pressure builds, key support level in focus
  FxWirePro: USD/CNY falls to three-year high, scope for further downside
  FxWirePro- Woodies Pivot(Major)
  EUR/JPY Breaks Out: Euro Surges Past 185.00 Resistance Amid Strong Bullish Momentum
  FxWirePro- Major Pair levels and bias summary
  FxWirePro- Major European Indices
  FxWirePro: USD/ZAR continues to recovers , upside pressure builds
  FxWirePro- Major Crypto levels and bias summary
  FxWirePro: EUR/AUD claws back some losses but rcovery likely muted
  FxWirePro:NZD/USD jumps as RBNZ warns of higher OCR potential
  FxWirePro: EUR/NZD remains under pressure as key support gives way
  Ethereum Reclaims Higher Ground: Ether Bulls Target $2,700 as Middle East Tensions Thaw
  Aussie Bulls Charge: AUD/JPY Rallies as Geopolitical Clouds Part
  FxWirePro: EUR/AUD falls below 1.6600 level, plunge to test a key fibo grows


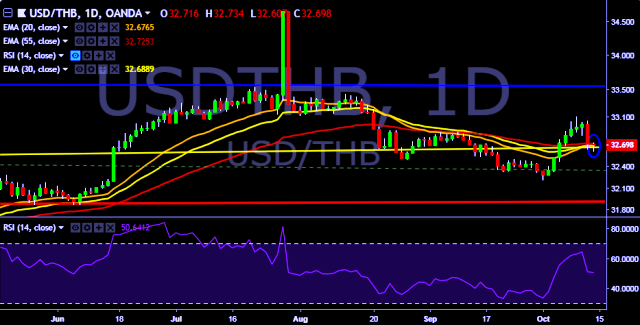
- USD/THB is currently trading around 32.70 marks.
- It made intraday high at 32.73 and low at 32.60 marks.
- Intraday bias remains bearish for the moment.
- On the top side, key resistances are seen at 32.70, 32.90, 33.05, 33.20, 33.37, 33.52, 33.78 and 33.96 marks respectively.
- Alternatively, a daily close below 32.70 will drag the parity down towards key supports around 32.46, 32.27, 32.18, 32.02 and 31.85 marks respectively.
- Important to note here that 20D, 30D and 55D EMA heads down and confirms the bearish trend in a daily chart.
We prefer to take short position on USD/THB around 32.72, stop loss 32.90 and target of 32.46/32.27.


