


 Global Markets React to Strong U.S. Jobs Data and Rising Yields
  FxWirePro: USD/ JPY slips as yen rallies after Mideast ceasefire declaration
  Bank of America Posts Strong Q4 2024 Results, Shares Rise
  Trump’s "Shock and Awe" Agenda: Executive Orders from Day One
  Gold Prices Slide as Rate Cut Prospects Diminish; Copper Gains on China Stimulus Hopes
  FxWirePro:NZD/USD jumps as RBNZ warns of higher OCR potential
  U.S. Banks Report Strong Q4 Profits Amid Investment Banking Surge
  FxWirePro- Woodies Pivot(Major)
  US Gas Market Poised for Supercycle: Bernstein Analysts
  Urban studies: Doing research when every city is different
  FxWirePro- Woodies Pivot(Major)
  Aussie Bulls Charge: AUD/JPY Rallies as Geopolitical Clouds Part
  U.S. Stocks vs. Bonds: Are Diverging Valuations Signaling a Shift?
  FxWirePro: GBP/AUD downtrend extends, eyes 1.8900 evel
  Indonesia Surprises Markets with Interest Rate Cut Amid Currency Pressure
  Euro Ascendant: EUR/USD Breaks $1.17 as Geopolitical Relief Sparks a Bullish Surge


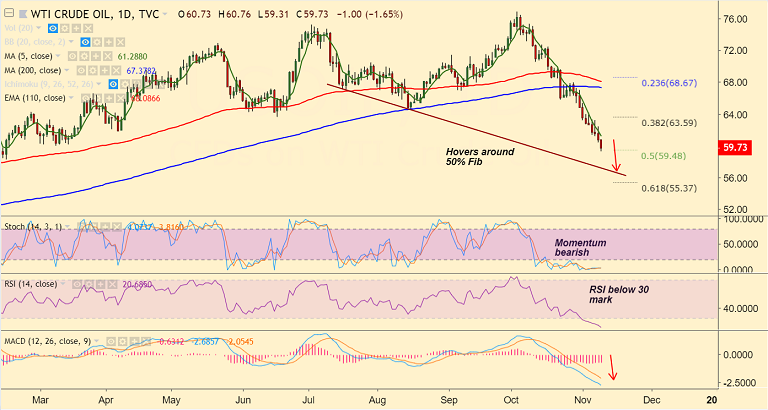
U.S. oil cart on Trading View used for analysis
- WTI extends declines for the 5th straight week, trades 2.11% lower on the day.
- Price has fallen below $60 per barrel and the still-rising crude supply levels to prompt further weakness.
- US Sanctions on Iran came into effect this week and crude prices largely ignored the news.
- Potential for a glut of global oversupply as the US, Russia, and Saudi Arable look to expand production keep pressure.
- Volatility rising on weekly charts, price has dipped below 110-EMA and eyes next major support at 61.8% Fib at 55.37.
- On the flipside, 5-DMA is immediate resistance at 62.25. Break above could see minor upside.
Support levels - 59.48 (50% Fib), 58.11 (Feb 9th low), 57.15 (trendline), 55.37 (61.8Fib)
Resistance levels - 60.56 (110W EMA), 61.28 (5-DMA), 63.59 (38.2% Fib)
For details on FxWirePro's Currency Strength Index, visit http://www.fxwirepro.com/currencyindex.


