


- Historical average -15
- Five years ago –Gold –Silver ratio is at 35
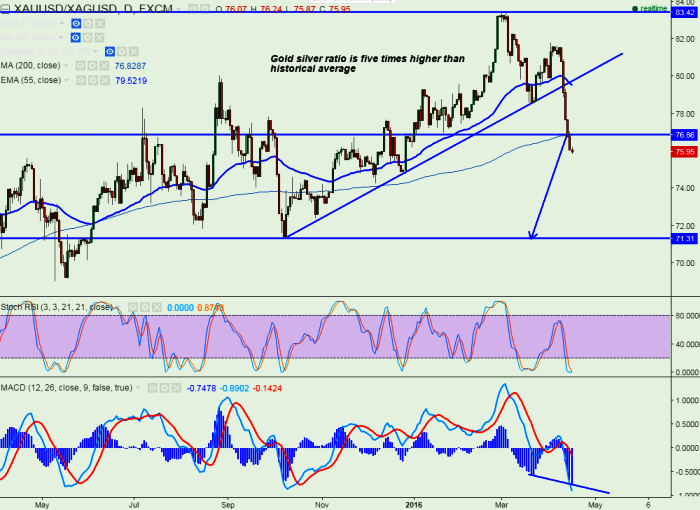
- Gold-Silver ratio measures the number of silver ounces it takes to buy a single ounce of gold.
- The spread is currently trading at 75.98. Gold –Silver ratio reached a peak of 83.45 on Mar 1st 2016, highest level since 2007-2008 financial crisis
. - Gold has gained (18.7%) significantly since beginning of 2016 compared to silver (15.6%).
- Technically the ratio has broken major support 76.83 (200 day MA) and declined till 75.98 at the time of writing.
- StochRsi is in oversold level and MACD is also showing bearish divergence in daily charts. So there is chance of increase in ratio to higher levels. But overall Gold silver ratio is expected to narrow till 71/68/60 in the short term.
Gold and Silver Technical’s
- In the first half of Apr 2016 Gold has made a high of $1284 and declined from that level .it is currently trading around $1229. Further bullishness can be seen only above $1285.
- But Silver gained from $14.76 (1st Apr 2016) and gained till $16.29. Major resistance is around $16.34 and aay break above targets $17/$17.80 in short term.


