


 FxWirePro- Major Crypto levels and bias summary
  FxWirePro- Major Crypto levels and bias summary


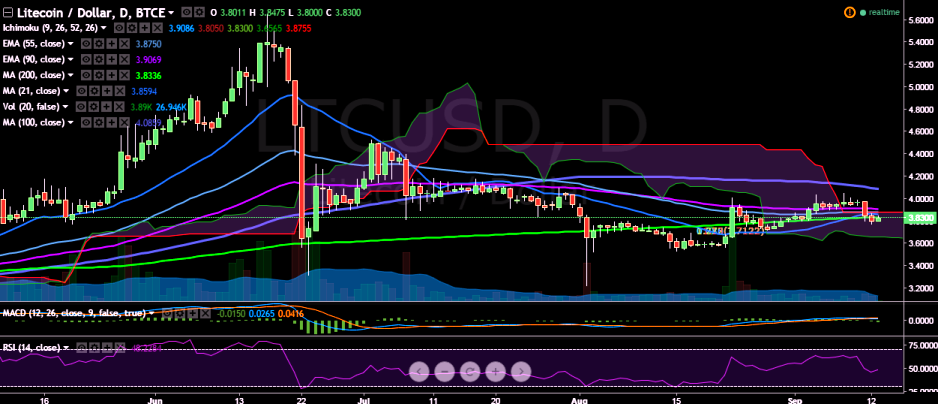
LTC/USD is struggling to reverse its losses and break above 200-day MA. It is currently trading at 3.80 levels (BTC-e).
Ichimoku analysis of daily chart:
Tenkan Sen: 3.90
Kijun Sen: 3.80
Trend reversal: 3.90 (90 EMA)
“As the pair is struggling to break above 200-day MA, the trend appears weak for LTC/USD. A dip till 3.50 is possible”, FxWirePro said in a statement.
The pair faces immediate resistance at 3.83 levels (200-day MA) and a break above would target 3.91 (90 EMA)/4.05 levels (September 08 high).
On the other side, support is seen at 3.63 (50% retracement of 3.22 and 4.05) and a break below would target 3.50 (psychological level)/ 3.22 (August 02 low).

- News

- Economy

- Central Banks
- Investing
- Research
- Roundups
- Digital Currency
- Insights
- Technical Analysis
- Technology
- Business
- Law
- Health
- Nature
- Fintech
- Science
- Topic
- Opinions
- ©Econometrics LLC . All Rights Reserved.
LTC/USD struggles to close above 200-day MA, decline till 3.50 likely
Tuesday, September 13, 2016 10:54 AM UTC
Editor's Picks


- Market Data
Most Popular


