


 Aussie Retreats Against the Yen: AUDJPY Bears Target 108 as 110 Resistance Holds Firm
  FxWirePro: EUR/ NZD consolidating around 2.0180 room for further gains
  Mexico's Undervalued Equity Market Offers Long-Term Investment Potential
  China's Refining Industry Faces Major Shakeup Amid Challenges
  Ethereum Retreats Toward USD 2,000: Technicals Signal Caution as ETH Mimics Bitcoin’s Pullback
  US Futures Rise as Investors Eye Earnings, Inflation Data, and Wildfire Impacts
  Stock Futures Dip as Investors Await Key Payrolls Data
  FxWirePro: USD/ZAR fibo rejection triggers sizeable pullback
  Euro Retreats as Geopolitical Tensions Surge: EURUSD Eyes 1.1400 Floor Amid Safe-Haven Demand
  FxWirePro: USD/CAD runs out of steam but maintains bullish outlook
  Global Markets React to Strong U.S. Jobs Data and Rising Yields
  FxWirePro- Major European Indices
  FxWirePro: GBP/USD recovers but bears are not done yet again
  FxWirePro: EUR/ NZD steadies around 2.0150, retains bid tone
  U.S. Treasury Yields Expected to Decline Amid Cooling Economic Pressures
  FxWirePro- Woodies Pivot(Major)
  Fed May Resume Rate Hikes: BofA Analysts Outline Key Scenarios


A Quick Glimpse on OPEC’s Inventory:
As per the OPEC’s MOMR Jan’2019, the production declined by more than 700,000 barrels a day last month, which was primarily driven by Saudi Arabi the de-facto head of OPEC and the world’s largest exporter of crude with a reduction of 468,000 barrels a day. The output drop comes as OPEC has just implemented official production cuts at the start of January as part of a deal reached late last year in an effort to rebalance an oversupplied market,
a 751,000 barrel-a-day decline in crude output last month, to average 31.58 million barrels a day.
In December, ICE Brent was on average $8.27, or 12.5%, lower mom at $57.67/b, while NYMEX WTI fell by $7.71, or 13.6%, mom to average $48.98/b.
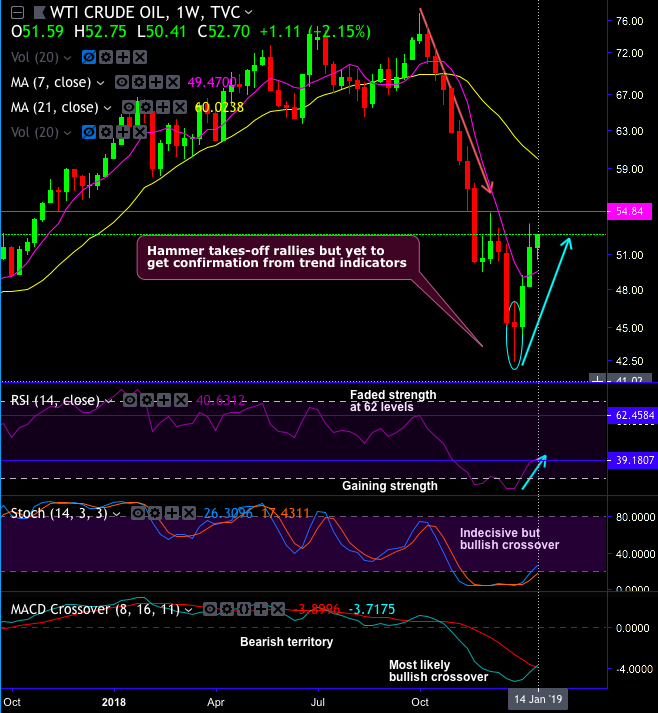
Technical Glance: On WTI crude weekly chart, hammer pattern has been traced at $45.04 levels which is bullish in nature, consequently, the recent rallies attempted to bounce above 7WMAs but were restrained below $53.29 levels. The minor trend appears to be gaining little strength as RSI begins to show upward convergence.
On a broader perspective, although we could see some abrupt minor rallies, both the leading & lagging indicators still signal weakness (refer monthly plotting).
Please be noted that on monthly terms, steep slumps are observed well below EMAs as the formation of 3-black crow patterns is completed at $45.40 levels,
Other bearish patterns, such as shooting star and hanging man candles have also occurred at 2018 peaks, ever since then, bears have managed to constantly nudge prices below EMAs and retrace more than 61.8% Fibonacci levels are observed.
For now, more weakness is foreseen on this timeframe, as well as both leading oscillators (RSI & stochastic curves) indicate faded strength in the previous consolidation phase and intensified selling momentum in the current bearish trend. While lagging indicators (EMA & MACD crossovers) also signal downtrend continuation.
Overall, hammer at $45.04 levels may have countered with rallies above DMAs & WMAs, as a result, more upswings seem to be on cards in short-run. But the major trend still remains edgy.
Trading Recommendations: Well, we’ve advocated directional WTI strategy just a few days ago when the underlying crude price was trading at $50.84 levels. The long leg now appears to be on the track of our estimation.
The strategy initiated: Long in CME WTI futures positions of Jan’2019 delivery and short CME WTI futures positions of Mar’2019 delivery. The strategy is to be executed with a view of arresting both upside/downside risks in the next 1-3-months’ time.
Currently, at spot reference: $52.62 levels, contemplating above scenarios, we wish to maintain the same strategy including long side, but, as the broader market tone is troublesome amid mild rallies in the near-term, we note that the continued decline in the WTI rallies testing fresh lows and threatening $45/bbl also makes the commodity-driven currencies vulnerable. Hence, CME WTI futures with narrowed tenors would be a wise move.
Currency Strength Index: FxWirePro's hourly EUR is at -50 (bearish), while USD is inching at 47 (which is bullish), at press time 06:27 GMT.
For more details on the index, please refer below weblink: http://www.fxwirepro.com/currencyindex


