


 How America courted increasingly destructive wildfires − and what that means for protecting homes today
  How is Antarctica melting, exactly? Crucial details are beginning to come into focus
  How ongoing deforestation is rooted in colonialism and its management practices
  We combed through old botanical surveys to track how plants on Australia’s islands are changing
  Ukraine minerals deal: the idea that natural resource extraction can build peace has been around for decades
  Parasites are ecological dark matter – and they need protecting
  How to create a thriving forest, not box-checking ‘tree cover’
  Extreme heat, flooding, wildfires – Colorado’s formerly incarcerated people on the hazards they faced behind bars
  GesiaPlatform Launches Carbon-Neutral Lifestyle App ‘Net Zero Heroes’
  Swimming in the sweet spot: how marine animals save energy on long journeys
  Fertile land for growing vegetables is at risk — but a scientific discovery could turn the tide


Beaches are dynamic. They change from week to week and month to month. Have you ever wondered what causes these changes? Or how beaches might fare as sea levels rise and if storms increase in frequency and severity?
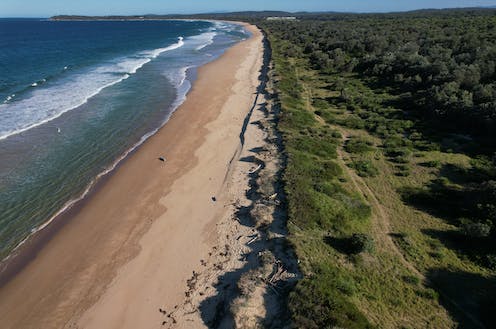
To help answer these questions, we studied 50 years of change at Bengello Beach, near the Moruya airport on the New South Wales south coast. This is a typical beach with moderate waves and no hard infrastructure such as sea walls or houses built over dunes. The results therefore represent natural beach change over half a century. This helps us understand the natural behaviour of beaches around the world.
We found the main driver of coastal erosion is frequent storms of moderate intensity. These storms remove sand from the beach. This sand is generally returned within a matter of months. But what about more extreme events?
In the 50 years of monitoring, offshore wave buoys recorded 21 storms where maximum waves heights exceeded ten metres. That’s roughly equivalent to the height of a three-story building. These larger events cause even greater erosion, so the beach takes longer to recover.
Big wave riding at Sydney’s Wedding Cake Island, near Coogee (7NEWS, May 2023)
The ‘biggest of the big’ storms
Some of the largest events in the record have been particularly destructive, for example the storm in June 2016 where a residential swimming pool washed onto the beach at Narrabeen-Collaroy. Or the June 2007 event when the Pasha Bulka container ship broke its mooring and washed up on Nobbys Beach in Newcastle. Both storms also caused substantial beach erosion at Bengello.
One sequence of storms stands out in the record. The successive storm events of May–June 1974 including the renowned Sygna Storm of May 1974. During these two months, more than a B-double truck full of sand was cut away at every metre strip of beach (95 cubic metres of sand per metre of beach), and the shoreline moved inland farther than the length of an Olympic swimming pool (63m).
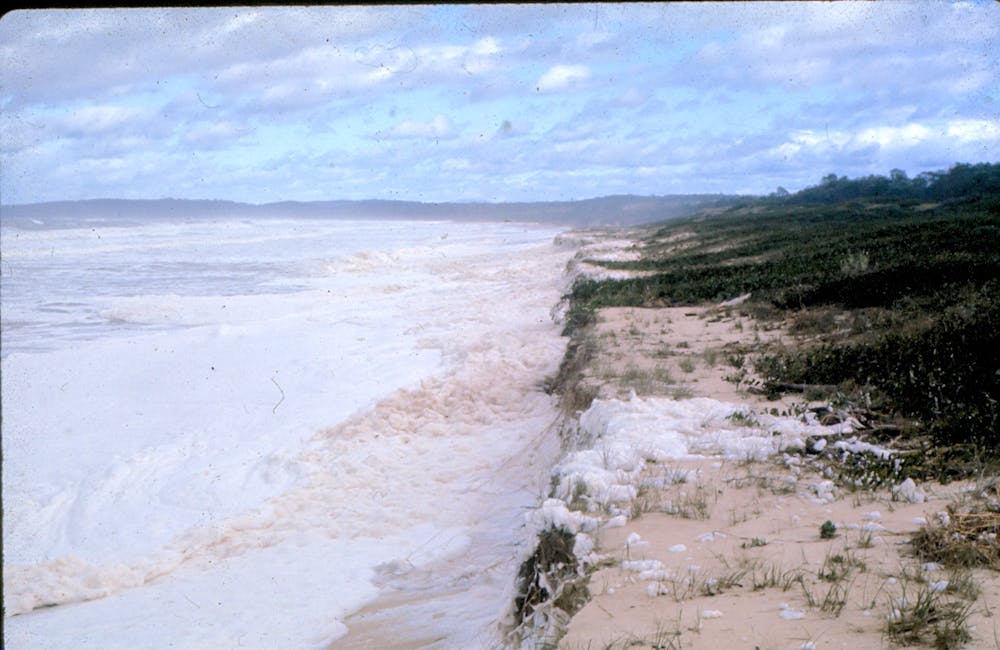
Bengello Beach suffered erosion during the May 1974 storm event. Note the vertical sand cliff carved into the dunes by wave action. Roger McLean
Astonishingly, it took five and half years for the beach to recover to its previous condition after these events. The recovery was hampered by more severe storms in 1976 and 1978, which interrupted the gradual build-up of beach sand.
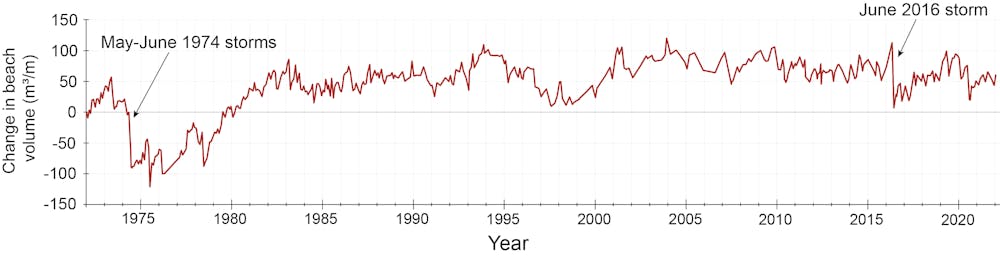
Beach volume changes at Bengello Beach from 1972 to 2022. Dips or downward trends indicate beach erosion, while positive spikes or upward trends indicate beach growth. Thomas Oliver
No other storms in the record have had such a huge impact on the beach. Importantly, this is our only quantitative record of this event because it occurred before satellite imagery was available. Therefore it is not captured by tools such as CoastSat and Digital Earth Australia Coastlines, which derive shoreline positions from more than 30 years of satellite images, and have proved so powerful in understanding recent shoreline changes.
But how often do the biggest storms occur? Looking into the past, research suggests an erosion event of this magnitude has occurred at least one other time in the past 500 years.
Can beaches survive future sea-level rise?
So how will beaches fare in a warming world where sea-level rise accelerates and coastal storms intensify?
This beach has sufficient sand to enable recovery after extreme storm events such as those experienced in the La Niña period of 1974–78. This degree of recovery is related to each beach’s so-called “sand budget”.
Recent research has even suggested extreme storms can replenish beaches with more sand from deeper waters.
Under present-day conditions this beach appears to have the capacity to fully recover. This means that it and other similar beaches with positive sand budgets can absorb certain levels of sea-level rise – but only up to a point. There will be a threshold beyond which a beach starts to retreat unless a new source of sand is supplied.
Sources of beach sand could come from deeper water offshore or from neighbouring beaches alongshore. These “credits” of sand into the beach budget may help them maintain their current position. Other NSW beaches in credit include the northern end of Seven Mile Beach near Gerroa, Nine Mile Beach north of Tuncurry and Dark Point just north of Hawks Nest. Around Australia, we can use time-series of shoreline change to estimate beach sand budgets.
Beaches in sand “defecit” are more vulnerable to sea level rise. Examples include the southern end of Stockton Beach and Old Bar in NSW and the northern end of Bribie Island in Queensland.
In a dynamic and volatile future, it is more important than ever that we maintain long-term records of beach change. This will ensure we have a critical baseline of data to test future projections. Monthly surveys at the site are continuing.


