Technicals

Add as a preferred source on Google

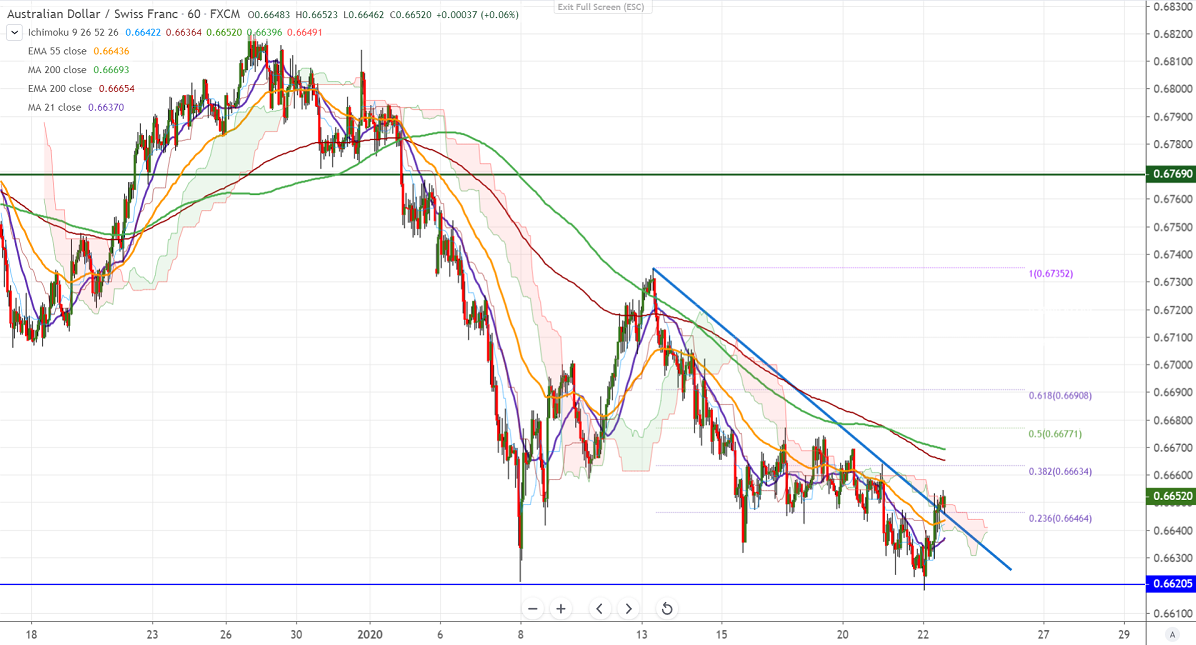
AUDCHF: Double bottom and trend line break out (chart of the day)

Chart pattern- Double bottom AUDCHF has formed a bottom near 0.6600 and shown a minor recovery of more than 30 pips. The jump was mainly due to a slight weakness in Swiss Franc against USD. USDCHF surged more than 100 pi…

1 min read
AUDCHF: Double bottom and trend line break out (chart of the day)
Image from the original EconoTimes article

Read the original article

Chart pattern- Double bottom


AUDCHF has formed a bottom near 0.6600 and shown a minor recovery of more than 30 pips. The jump was mainly due to a slight weakness in Swiss Franc against USD. USDCHF surged more than 100 pips after forming a bottom around 0.96130. Markets eye Australian employment data and unemployment rate which is to be released tomorrow for further direction.


Technically, the pair is trading slightly above trend line but it should break above 0.6670 9200- H MA) for further jump till 0.6690/0.6735.


On the flip side, immediate support is at 0.6600 and any convincing break below will drag the pair down till 0.6500 level.


It is good to buy on dips around 0.6620-225 with SL around 0.6600 for the TP of 0.6735.

Related articles

View all
Technicals

Major Pair Currency Score: AUDUSD Bearish

EURUSD - Levels to watch - 1.100 GBPUSD Levels to watch - 1.3180 USDCHF Levels to watch - 0.8400 USDCAD - Levels to watch - 1.4300 AUDUSD - Levels to watch - 0.7000 NZDUSD - Levels to watch - 0.5560

