


 FxWirePro- Major Crypto levels and bias summary
  NZDJPY Bullish Surge: Strong Kiwi Ignites Fresh Upside as 94 Support Holds and All EMAs Align
  FxWirePro:EUR/NZD dips below lower range, bearish bias increases
  FxWirePro: NZD/USD steadies around 0.5830,retains bid tone
  FxWirePro: NZD/USD trades in narrow range ,outlook bullish
  FxWirePro:EUR/NZD extends fall, key support lies ahead
  GBPUSD, AUDUSD & NZDUSD Turn Extremely Bullish: Strong Positive Momentum Drives Major Pair Action Bias
  FxWirePro- Woodies pivot (Major)
  FxWirePro- Major Crypto levels and bias summary


 - EconoTimes)


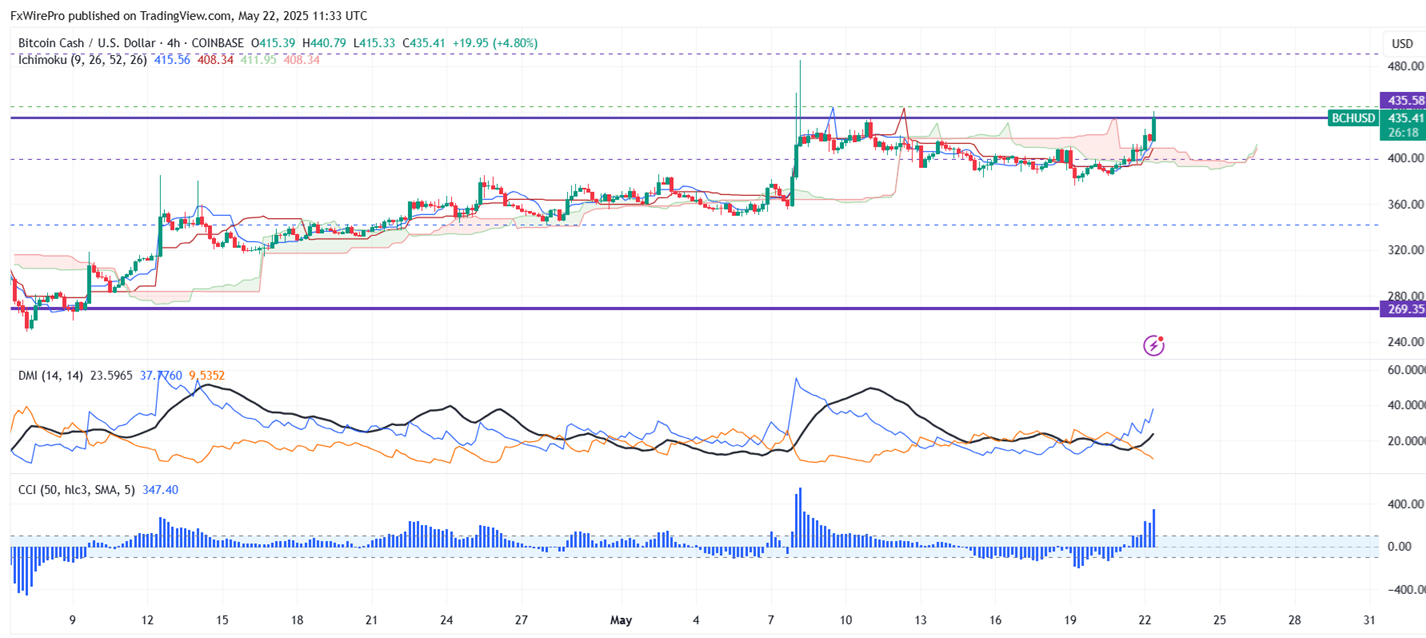
Ichimoku analysis (4 -hour chart)
Tenken-Sen- $407.75
Kijun-Sen- $400.75
BCHUSD breaks significant resistance $435 and started to catch Bitcoin.It hits a high of $440.79 and is currently trading around $435.42. Overall trend is bullish as long as support $379 holds.
The pair holds above the short-term (34 and 55-day EMA) and the long-term moving average (200-day EMA).
The near-term resistance is around $445, any indicative breach above will take the pair to $466/$500/$525/$548/$600/$640. On the lower side, immediate support is $400, and any violation below targets $377/$349/$325.
Indicators ( 4- hour chart)
Directional movement index - Bullish
It is good to buy on dips around $425-27 with SL around $375 for TP of $640.


