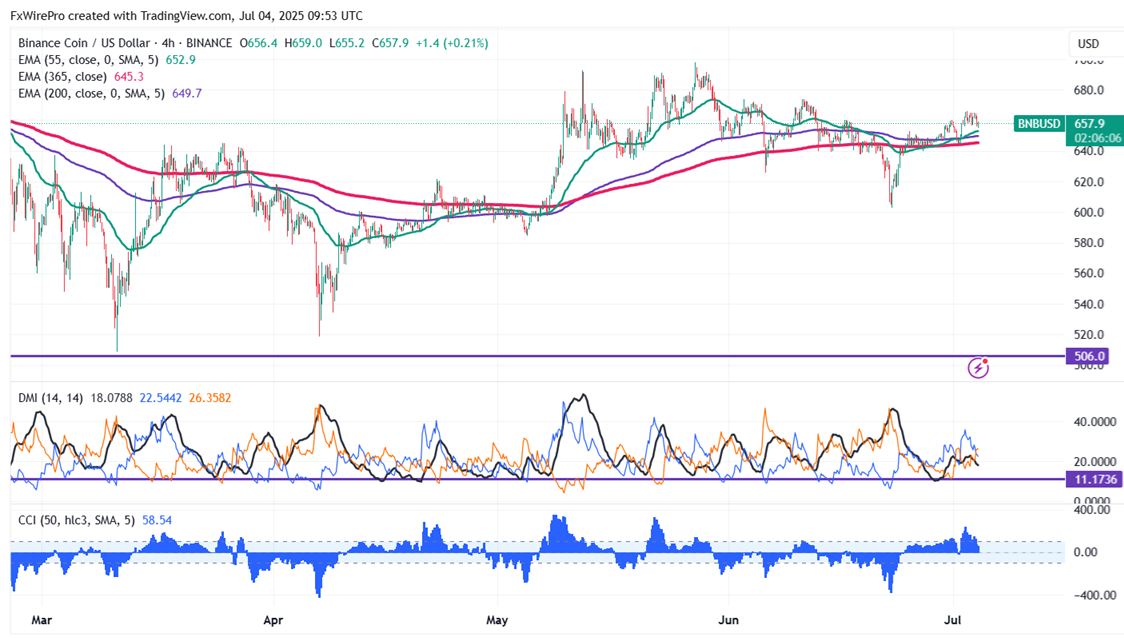
BNB/USD is consolidating after a minor pullback. It hit a high of $665 yesterday and is currently trading around $658.40.
Short-term trend remains bullish as long as the support $598 holds. It trades above the 55 and 34, 200 and 365 EMA on the 4-hour chart. Near-term support is around $645 (365- EMA), any close below targets $628/$598/$570/$520. If the pair closes below $500, potentially lead to further declines towards $400.
Immediate Resistance is at $669.Any breakout above this resistance confirms bullish momentum and a jump towards $680/$730/$800/$1000.
Indicators (4- hour Chart)
- Directional Movement Index: Neutral
- CCI (50): Bullish
Trading Strategy
It is good to buy on dips around $650 with a stop-loss set at $635 and a target price of $800/$1000.



AUDJPY Suffers as Yen Buying Pressure Mounts; Bearish Outlook Persists
FxWirePro- Major Crypto levels and bias summary
FxWirePro: EUR/AUD range-bound as ECB rate decision and U.S inflation data take focus
Market Outlook: Crypto Score Signals Extremely Bullish Structure Across BTC, ETH, SOL, and BNB
FxWirePro- Major Pair levels and bias summary
FxWirePro: USD/ZAR downside risk builds after SA Q2 GDP contraction
FxWirePro: GBP/AUD hovers near 3-month low, vulnerable to more downside
NZDJPY Plummets Below 90; Downtrend Favors Sellers on Pullbacks
Crypto Major Score: BNBUSD and SOLUSD Signal Strong Bullish Momentum
FxWirePro: USD/CNY extends fall as yuan firms on exports, inflation data
FxWirePro: GBP/USD edges lower amid geopolitical tensions and inflation fears 


