


 FxWirePro- Major Crypto levels and bias summary
  FxWirePro- Major Crypto levels and bias summary
  FxWirePro- Major Crypto levels and bias summary
  BTCUSD Bullish Breakout: Clears 800-EMA After Consolidation, Buy Dips Toward $74,900
  ETHUSD Bullish Momentum: Follows BTC Above All EMAs, Buy Dips Near $1750 Targeting $2300


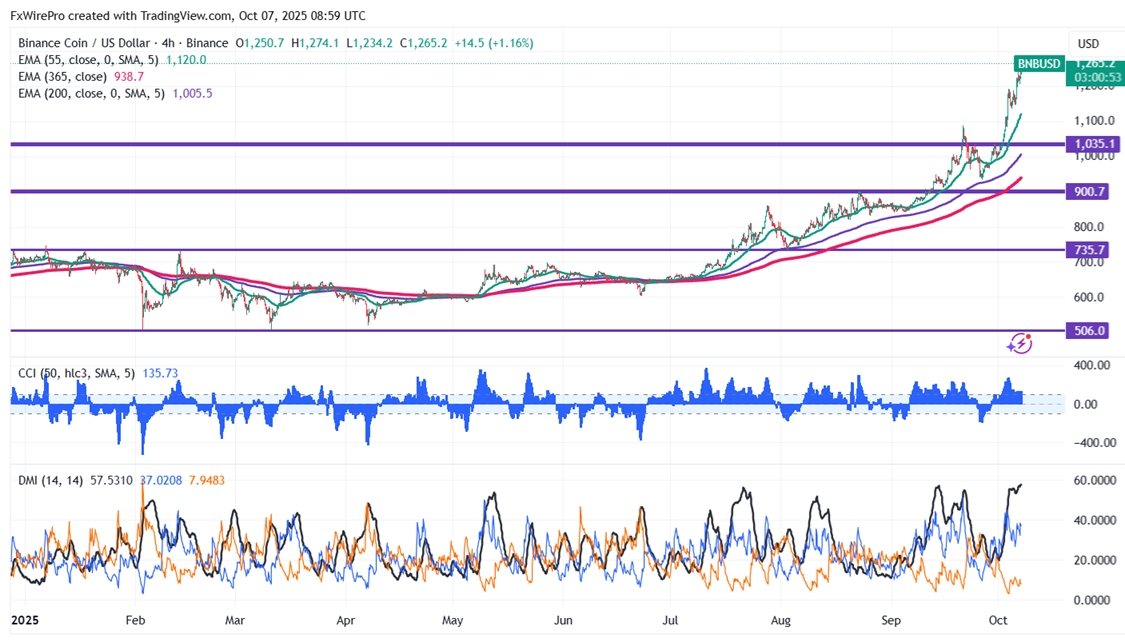
Following in the footsteps of Bitcoin, BNBUSD reaches a new all-time high. It is now trading at about $1245.60, having reached a new record of $1263.60.
Oscillators and moving averages to forecast the trend of BNBUSD
CMP- $1245.60
EMA (4-hour chart)
55-EMA- $1114
200-EMA- $1002
365-EMA- $936.90. The pair trades above the short and long-term moving averages.
Major support - $1200. Any breach below $1200 will drag the pair down to $1130/$1086/$1044/$985/$930.
Major Resistance - $1250. Any break above $1250 confirms minor bullishness; a jump to $1300/$1350 is possible.
Indicators (4-hour chart)
CCI(50)- Bullish
ADX- above 50 showing bullish bias
Investment Strategy for BNBUSD
It is good to buy on dips around $1180 with a stop loss around $1130 for target profits of $1300/$1350.


