


 FxWirePro: GBP/NZD gains some upside momentum but still bearish
  EUR/USD Holds Bullish Tone Despite Pullback from Yesterday’s High
  FxWirePro: GBP/NZD downtrend slows, but bearish sentiment remains
  FxWirePro: EUR/AUD bears maintain upper hand
  FxWirePro- Major Crypto levels and bias summary
  FxWirePro- Major Crypto levels and bias summary
  FxWirePro- Major Pair levels and bias summary
  FxWirePro- Major Crypto levels and bias summary


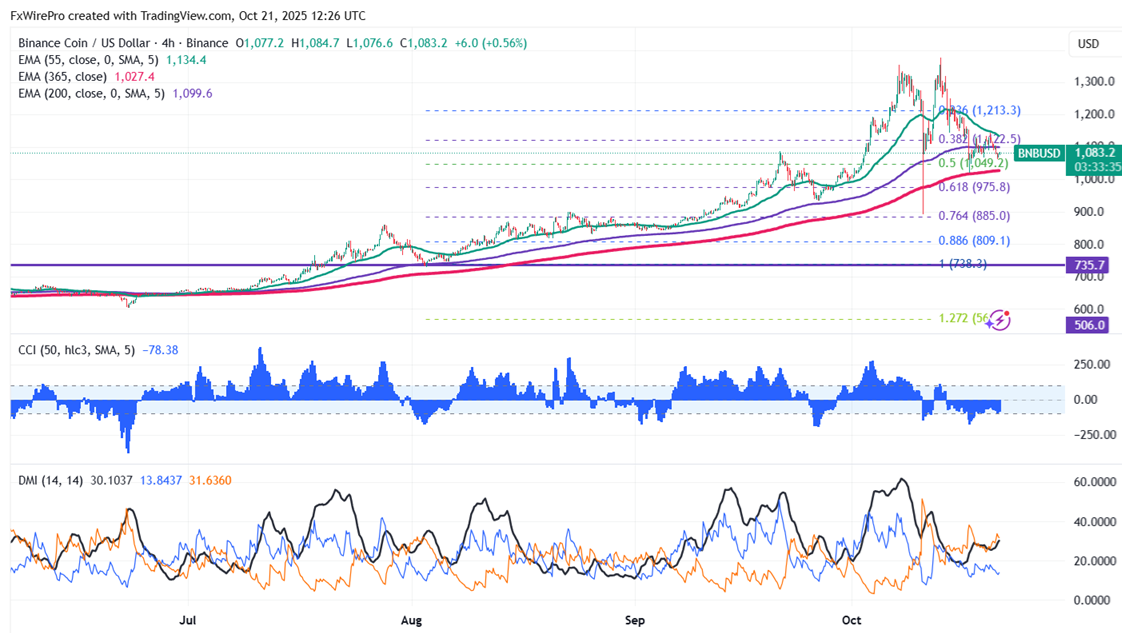
Following the path of BTC, BNBUSD trading is subdued. Having traded as high as $1,079.90, it is now at roughly $1079.
Oscillators and moving averages to forecast the trend of BNBUSD
CMP- $1079.90
EMA (4-hour chart)
55-EMA- $1136
200-EMA- $1099.80
365-EMA- $1027. The pair trades below the short-term and above the 365-4H and below the 200-4H EMA.
Major support - $1020. Any breach below $1020 will drag the pair down to $975/$930.
Major Resistance - $1100. Any break above $1100 confirms minor bullishness; a jump to $1150/$1200/$1250/$1300/$1376/$1400/$1500 is possible.
Indicators (4-hour chart)
CCI(50)- Bearish
ADX- Bearish
Investment Strategy for BNBUSD
It is good to buy on dips around $1020 with a stop loss around $890 for target profits of $1300/$1350.


