


 FxWirePro- Major Crypto levels and bias summary
  ETHUSD Bullish Momentum: Follows BTC Above All EMAs, Buy Dips Near $1750 Targeting $2300
  FxWirePro- Major Crypto levels and bias summary
  FxWirePro- Major Crypto levels and bias summary
  FxWirePro- Major Crypto levels and bias summary


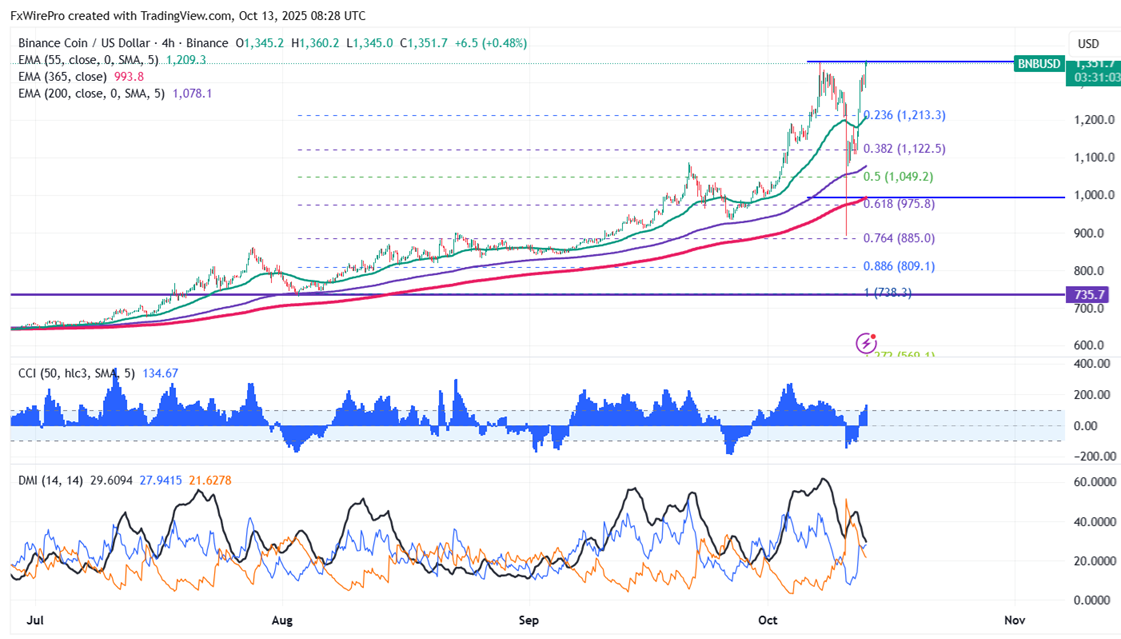
BNBUSD showed a nice recovery after a massive sell-off of more than $400 from a fresh all-time high due to tariff concerns. It hit a low of $891 and is currently trading around $1355.
Oscillators and moving averages to forecast the trend of BNBUSD
CMP- $1355
EMA (4-hour chart)
55-EMA- $1204
200-EMA- $1075
365-EMA- $991.80. The pair trades above both short-term and long-term moving averages.
Major support - $1250. Any breach below $1250 will drag the pair down to $1200/$1130/$1086/$1044/$985/$930.
Major Resistance - $1355. Any break above $1355 confirms minor bullishness; a jump to $1400/$1500 is possible.
Indicators (4-hour chart)
CCI(50)- Bullish
ADX- Neutral
Investment Strategy for BNBUSD
It is good to buy on dips around $1248-50 with a stop loss around $1180 for target profits of $1500.


