


 FxWirePro: EUR/AUD bears maintain upper hand
  FxWirePro: GBP/NZD gains some upside momentum but still bearish
  FxWirePro: NZD/USD steadies around 0.5830,retains bid tone
  Crypto Major Pair Action Bias: ETHUSD Bullish as BTCUSD, SOLUSD & XRPUSD Stay Neutral
  Major JPY Action Bias — Extremely Bullish Setups in NZD/JPY, AUD/JPY and CAD/JPY
  FxWirePro- Major Pair levels and bias summary
  ETHUSD Bullish Momentum: Follows BTC Above All EMAs, Buy Dips Near $1750 Targeting $2300
  AUDJPY Extremely Bullish Above 113: Strong AUD Fuels Fresh Rally – Buy Dips at 113 Targeting 115
  FxWirePro- Major Pair levels and bias summary
  FxWirePro: USD/CAD falls after BoC rate hold and weak U.S. producer inflation


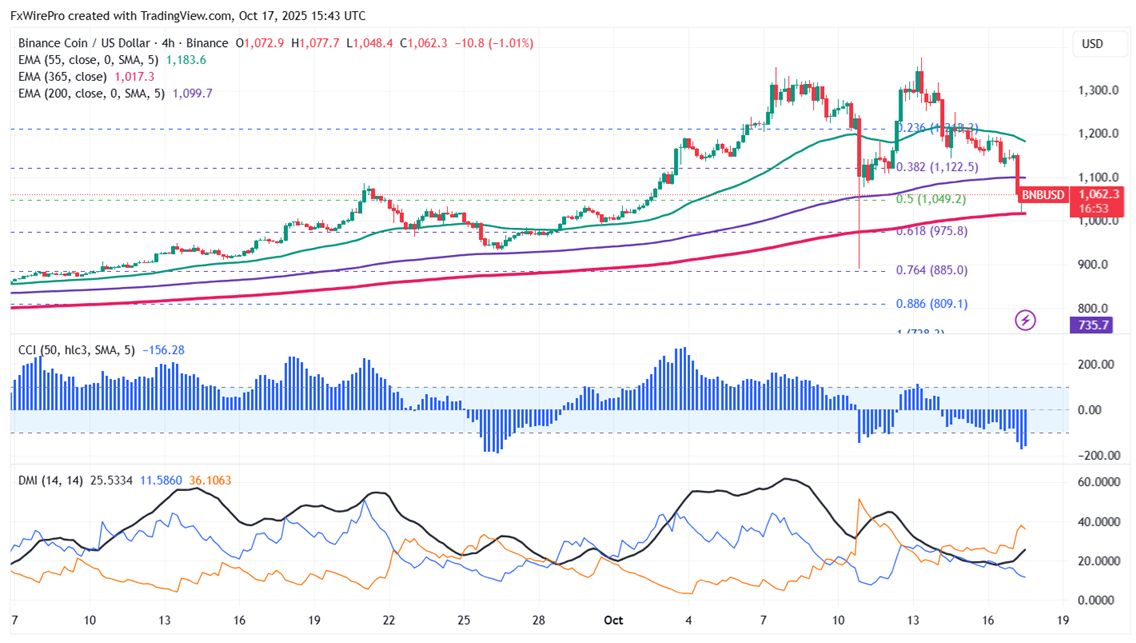
Following in the footsteps of BTC, BNBUSD shed most of its gains. Having reached $1022 intraday, it is now trading at about $1064.
Oscillators and moving averages to forecast the trend of BNBUSD
CMP- $1058
EMA (4-hour chart)
55-EMA- $1188
200-EMA- $1100
365-EMA- $1017. The pair trades below short-term and above 365-4H and below 200-4H EMA.
Major support - $1020. Any breach below $1020 will drag the pair down to $975/$930.
Major Resistance - $1100. Any break above $1100 confirms minor bullishness; a jump to $1200/$1250/$1300/$1376/$1400/$1500 is possible.
Indicators (4-hour chart)
CCI(50)- Bearish
ADX- Neutral
Investment Strategy for BNBUSD
It is good to buy on dips around $1022 with a stop loss around $890 for target profits of $1300/$1350.


