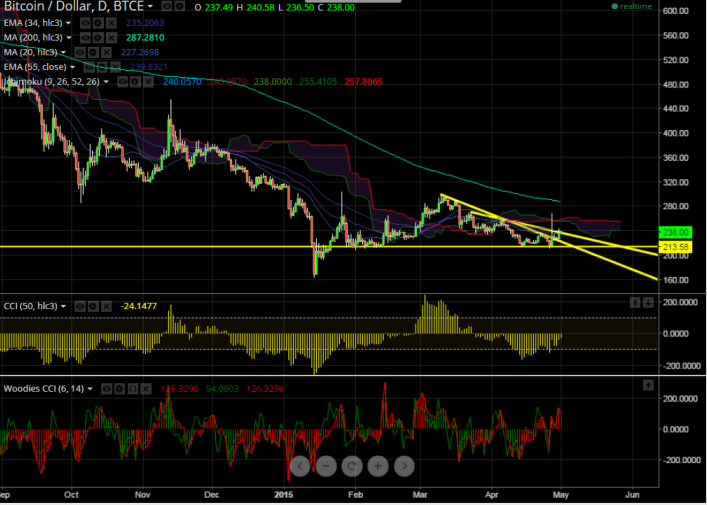
BTC/USD is trading well above both short term resistance $237 (trend line joining $269.90 and $258.80) and also long term resistance $225 (trend line joining $299 and $257.48) and this confirms short term bullishness, a …
BTC/USD is trading well above both short term resistance $237 (trend line joining $269.90 and $258.80) and also long term resistance $225 (trend line joining $299 and $257.48) and this confirms short term bullishness, a jump till $258 cannot be ruled out.
On the down side short term weakness only below $224 and any break below will take the pair further down till $211.
Indicator (Daily chart)
CCI (50) - Buy
Woodies CCI (14) - Buy
Ichimoku- Buy
It is good to buy around $235 with stop around $224 for the target of $258.
A White House official confirmed Witt’s detail had expired in a statement relayed by Eleanor Terrett on Oct. 14. The Senate rejected cloture on a motion to proceed to H.R. 3633 by 49 votes to 50 on Sept. 15.