


 BTCUSD Bullish Breakout: Clears 800-EMA After Consolidation, Buy Dips Toward $74,900
  FxWirePro: GBP/NZD slips as Middle East tensions fuel risk aversion
  GBPJPY Bullish Bias Stays Strong: Buy the 217 Dip, Target 220
  EURJPY Bullish Bias Holds Strong: Buy the 184.80 Dip Toward 187
  FxWirePro :USD/JPY hovers near 40-year high, bias bullish
  FxWirePro- Major Crypto levels and bias summary
  NZDJPY Smashes 4-Month High on Kiwi Buying Frenzy – Bullish Setup Remains Strong
  EUR/JPY Poised to Slide — Sell Rallies into 185.30 with Eye on 183"
  FxWirePro: USD/ CNY gains some ground but bearish outlook persists


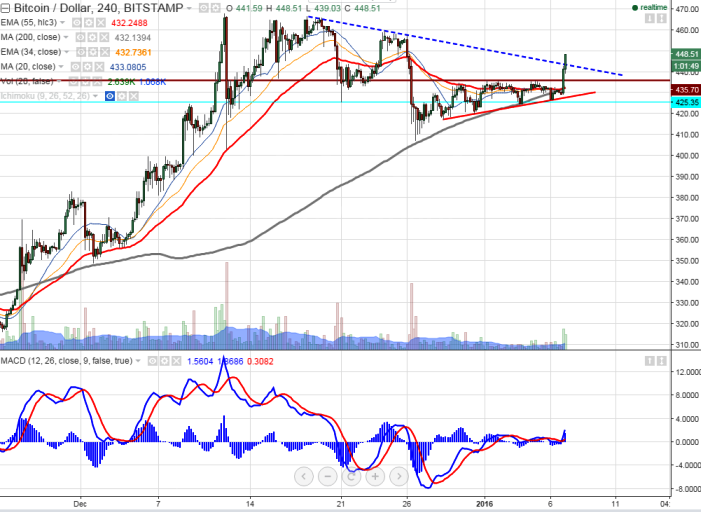
- Chart Pattern Formed- Ascending Triangle Pattern
- BTC/USD has broken major resistance $436 which confirms minor trend reversal a jump till $468 is possible.
- Short term trend is still bullish as long as support $424 holds.
- The pair's minor resistance is around $443 and any break above will take the pair to next level till $468/$480/$500 is possible. Overall trend reversal can be seen only below $400.
- On the lower side below $424 will drag the pair to next level $400/$380 .
It is good to buy at dips around $440 with SL around $424 for the TP of $468/$480/$500


