


 FxWirePro- Major Crypto levels and bias summary
  BTC’s Bear Bounce: Sell the Rally Near $66K as Bears Target $59K–$52K Breakdown
  FxWirePro- Major Crypto levels and bias summary


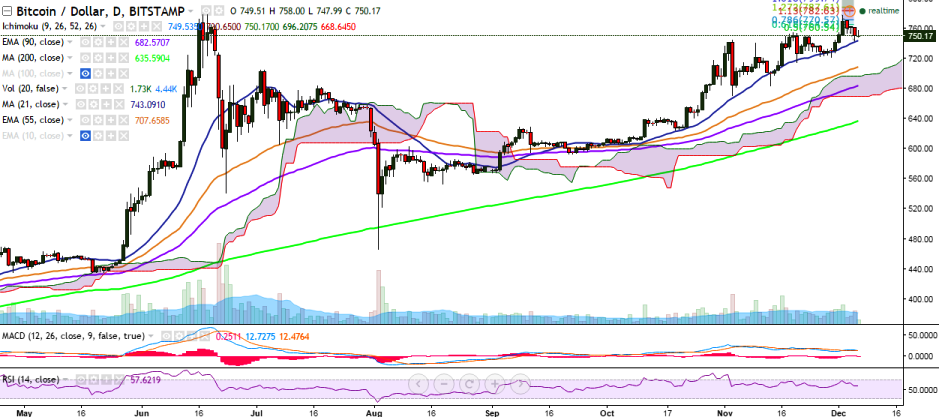
BTC/USD fell to 743 levels on Monday after it hit 778.07 levels on December 02. It currently trades at 748 levels (Bitstamp).
Long-term trend: Bullish
Short-term trend: Bullish
Ichimoku analysis of daily chart:
Tenkan Sen: 749.53
Kijun Sen: 730.65
Trend reversal: 681.05 (90 EMA)
On the upside, the pair faces immediate resistance at 760.54 (50% retracement of 778 and 743) and a break above would target 778.07 (December 02 high). A break above this level would confirm further bullishness in the pair and see it testing 799.74 (161.8% retracement of 778.07 and 743).
On the down side, the pair has taken support near 741.22 (21-day MA) and a break below would see a dip till 714 (November 20 low)/ 700.

- News

- Economy

- Central Banks
- Investing
- Research
- Roundups
- Digital Currency
- Insights
- Technical Analysis
- Technology
- Business
- Law
- Health
- Nature
- Fintech
- Science
- Topic
- Opinions
- ©Econometrics LLC . All Rights Reserved.
BTC/USD takes support at 21-DMA, break above 778 targets 800
Tuesday, December 6, 2016 7:15 AM UTC
Editor's Picks


- Market Data
Most Popular


