


 FxWirePro- Major Crypto levels and bias summary
  Ethereum Cracks Under $1,700: Sell the Rally Near $1,750 as Bears Eye $1,380–$1,200


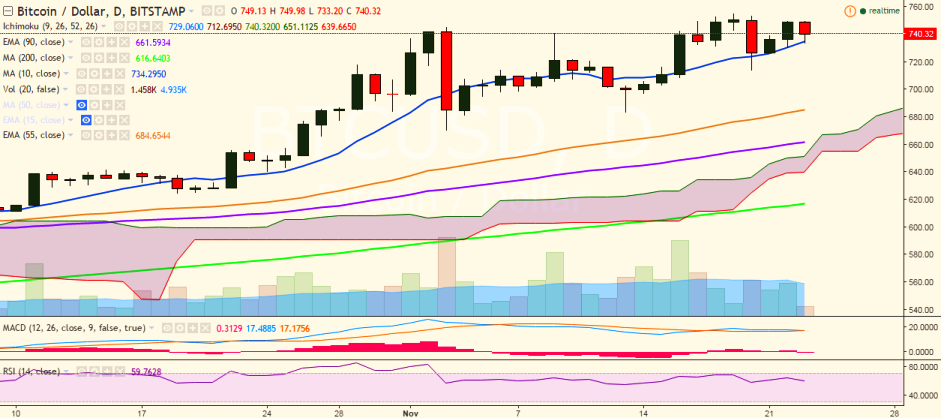
BTC/USD is struggling to break above the previous high of 755 levels (November 19 high) and is currently trading at 740 levels (Bitstamp).
Long-term trend: Bullish
Short-term trend: Bullish
Ichimoku analysis of daily chart:
Tenkan Sen: 726.10
Kijun Sen: 712.69
Trend reversal: 659.82 (90 EMA)
The pair’s upside is being capped by 753.24 (113% retracement of 745 and 683) and further bullishness would be seen if it breaks above 755 levels (November 19 high). Further strength would see the pair testing 778.85 (June 18 high)/800 (psychological level).
On the reverse side, 730.30 (10-day MA) is acting as a support for the pair. A break below would drag it to 714 (November 20 low)/ 702 (61.8% retracement of 670.32 and 755.07).

- News

- Economy

- Central Banks
- Investing
- Research
- Roundups
- Digital Currency
- Insights
- Technical Analysis
- Technology
- Business
- Law
- Health
- Nature
- Fintech
- Science
- Topic
- Opinions
- ©Econometrics LLC . All Rights Reserved.
BTC/USD upside capped by 113% Fib, further bullishness only above 755
Wednesday, November 23, 2016 10:46 AM UTC
Editor's Picks


- Market Data
Most Popular


