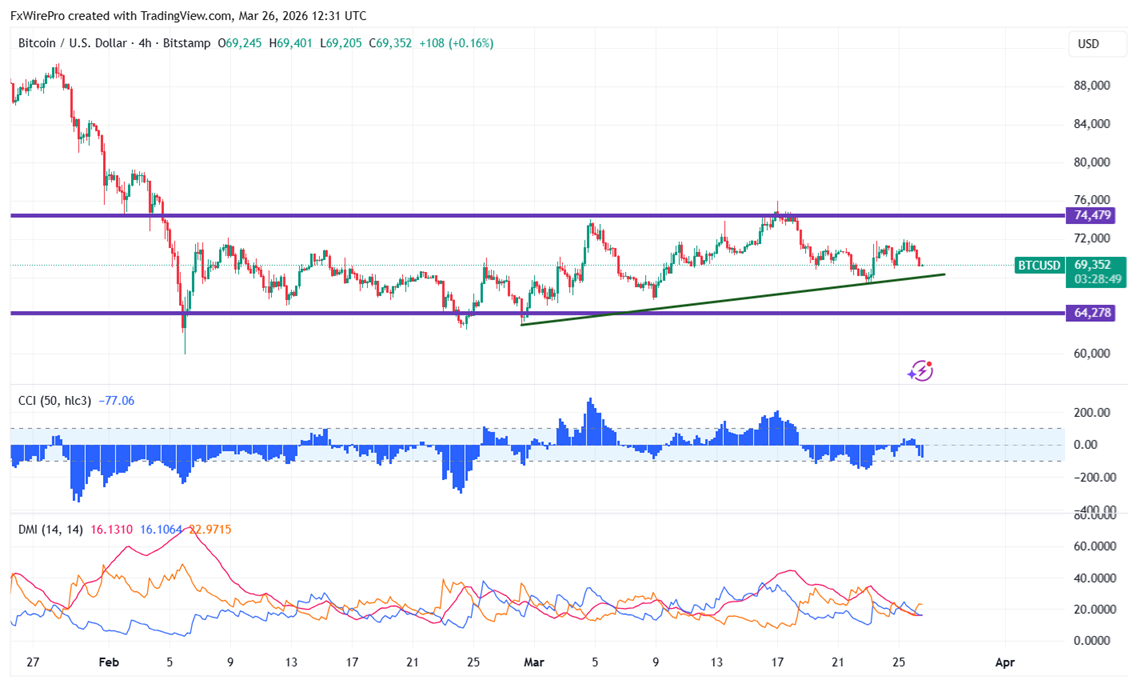
Following Iran's rejection of a 15-point ceasefire plan, BTCUSD lost most of its gains. Its price right now is about $69396, and it reached $72016 today.
|
Technicals |
CMP -$69351 |
Trend |
|
|
4- Hour chart |
Value |
|
|
|
55 EMA |
$70476 |
CMP< 55 EMA |
Bearish |
|
200- EMA |
$70735 |
CMP <200- EMA |
Bearish |
|
365- EMA |
$73394 |
CMP <365 EMA |
Bearish |
Major support- $67000/$64000/$60000/$52500/$50000. Minor bullishness only above $72500. Any break above targets $74500/$76200/$80000/$85500.
|
Momentum indicator (4-hour chart) |
Inference |
Value |
|
CCI(50) |
Neutral |
-65.70 |
|
ADX |
Neutral |
|
It is good to buy on dips around $67000 with SL around $64000 for a TP of $80000.