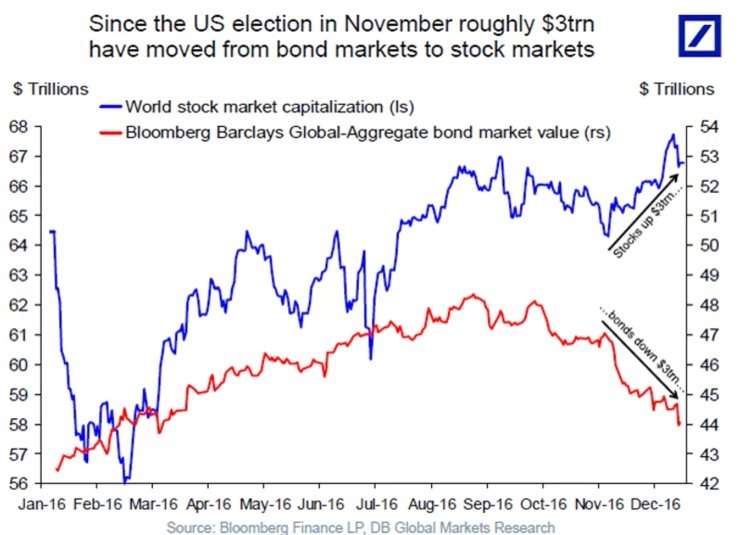
This self-explaining beautiful chart from Deutsche bank, shared by Bloomberg shows the flow of money as much as $3 trillion from the bond market to equities, since the US election in November.
Commentary
 Add as a preferred source on Google
This self-explaining beautiful chart from Deutsche bank, shared by Bloomberg shows the flow of money as much as $3 trillion from the bond market to equities, since the US election in November.
This self-explaining beautiful chart from Deutsche bank, shared by Bloomberg shows the flow of money as much as $3 trillion from the bond market to equities, since the US election in November.
Gold prices edged lower on Monday as stronger-than-expected U.S. nonfarm payrolls data dampened hopes for aggressive Federal Reserve rate cuts, bolstering the dollar. Spot gold slipped 0.1% to $2,686.32 an ounce, while F…
On-chain data shows BTC whales moved 10000 BTC from Crypto exchanges. This indicate accumulation of BTC by whales. Japanese public company Metaplanet buys another 1 billion yen worth of Bitcoin. According to Santiment, t…
Personal income increased by 0.2% month over month In August, which was less than the 0.4% market forecast and less than the 0.3% growth in July. For the third consecutive month, real personal disposable income increased…