Commentary

Add as a preferred source on Google

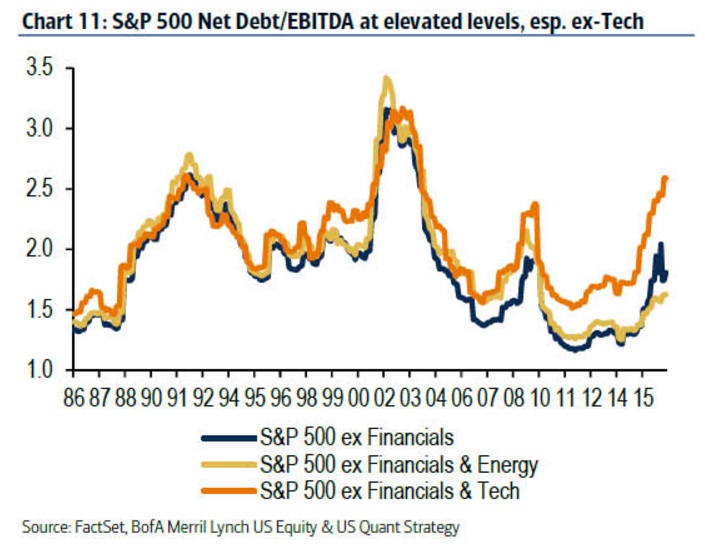
Chart of the Day: worsening debt levels of S&P 500

According to this chart from Bank of America Merrill Lynch (BofAML), obtained via Zerohedge.com, shows that the U.S. benchmark stock index S&P 500 looks pretty expensive. Net debt to EBITDA is at levels not seen since th…

Updated 1 min read
Chart of the Day: worsening debt levels of S&P 500
Chart courtesy - BofAML, Zerohedge.com

Read the original article

According to this chart from Bank of America Merrill Lynch (BofAML), obtained via Zerohedge.com, shows that the U.S. benchmark stock index S&P 500 looks pretty expensive. Net debt to EBITDA is at levels not seen since the dot-com bubble. Many would like to point out that dogged by lower growth, companies have been using debt to boost their share prices via higher dividends and buybacks. 

Unless growth improves, this could finally end in another debt crisis.

Related articles

View all
