


 Gold's 365-Day EMA Streak Since Oct 2023 Faces Its First Real Test at $3,980 — Break or Bounce to $4,140?
  How Donald Trump has changed the way diplomacy is done
  How AI prompting turned writerly description into an everyday skill
  SpaceX Stock Gets $175 Target as Analysts See Massive Growth Ahead
  Today’s space race could turn fatal if we don’t agree on new rules


 - EconoTimes)


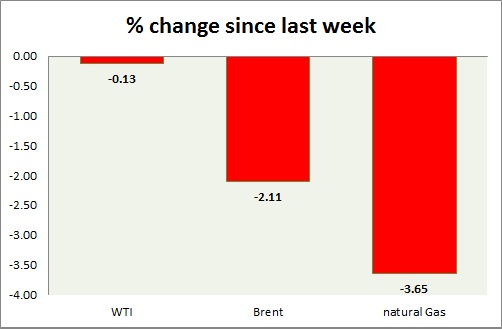
Energy pack is doing very well in spite of dollar strength. Weekly performance at a glance in chart & table.
Oil (WTI) -
- WTI traded as high as $60 post CPI release and showing overall strength in dollar. Currencies have been major victim of today's strength of dollar.
- WTI carved bearish doji in weekly chart and very bearish grave stone doji in daily chart. Further downside remains open if doji high is not taken out. RSI is also around 50 level resistance.
- WTI chart shows that prices might be curving a top.
- WTI is currently trading at $59.8/barrel. Immediate support lies at $55-54.6, $51.2-50 and resistance at $63-$65. $58 may continue to provide interim support.
Oil (Brent) -
- Brent dropped further against WTI.
- Brent-WTI dropped 30 cents today, currently trading at $5.7/barrel. Further downside remains open.
- Brent is trading at $65.5/barrel. Immediate support lies at $63.7-63.2, 61.8-61.4 area and resistance at $ 70 region.
Natural Gas -
- Natural gas rally was halted at $2.97, suggesting further correction towards support area.
- Natural gas injection to storage has remained relatively weaker than prior.
- Price target for bulls are coming close to $3.5/mmbtu, should support at $2.45 holds. Averaging it as low as possible would diminish risk.
- Natural Gas is currently trading at $2.90/mmbtu. Immediate support lies at $2.78 area & resistance at $3.32.
|
WTI |
-0.13% |
|
Brent |
-2.11% |
|
Natural Gas |
-3.65% |


