


 Bank Regulation Rollbacks in the U.S. and UK Could Increase Financial Risks, Study Warns
  China’s AI Manufacturing Boom Masks Weak Consumer Economy, Citi Says
  World Cup technology: from ref cams to AI analysts, cutting-edge research is changing the game
  How AI prompting turned writerly description into an everyday skill
  Trump’s Iran Strategy: What Has Been Achieved After Three Months of Conflict?
  Goldman Sachs: US Dollar Likely to Stay Strong Despite Oil Price Retreat
  Today’s space race could turn fatal if we don’t agree on new rules
  How Donald Trump has changed the way diplomacy is done
  Morgan Stanley Sees Chinese Auto Market Recovery Gaining Momentum in Late Summer


 - EconoTimes)


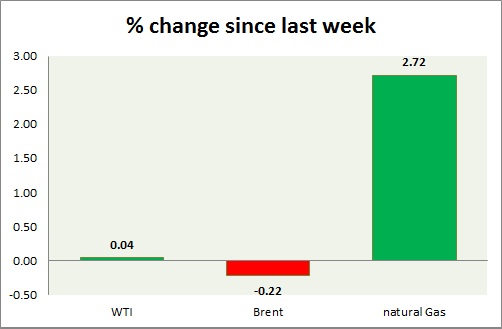
Energy pack is mixed, while oil is down, gas is in green. Weekly performance at a glance in chart & table.
Oil (WTI) -
- WTI is the worst performer today.
- WTI facing resistance around $54 area. Today's range $53.2-51.2
- Target for the downside is reached around $50-51/barrel, a further fall towards $42 seems likely.
- WTI is currently trading at $52.9/barrel. Immediate support lies at $51.2-50 and resistance at $54
Oil (Brent) -
- Eluded Iran deal so far is keeping things at bay for Brent.
- OPEC monthly oil report showed, Saudi Arabia's output at record 10.6 million barrels/day.
- Brent-WTI spread dropped 20 cents today, currently trading at $5.8/barrel.
- Target is reached around $55/barrel, and next target is around $51/barrel.
- Brent is trading at $58.6/barrel. Immediate support lies at $55 area and resistance at $59/60 region.
Natural Gas -
- Natural gas bulls pushed higher after price sharply jumped back from breaking to downside.
- Bulls and Bears are in strong collision to gain control. Upside target is coming around $3.1 with stop around $2.65, while down side is round $2.35 with stop around $2.98.
- Bullish Doji, in weekly chart remains in focus.
- Natural Gas is currently trading at $2.86/mmbtu. Immediate support lies at $2.55, $2.45 area & resistance at $2.93, $3.04, $3.32.
|
WTI |
+0.04% |
|
Brent |
-0.22% |
|
Natural Gas |
+2.72% |


