


 J.P. Morgan Sees Potential Vestas Guidance Upgrade Amid Strong Wind Energy Demand
  How Donald Trump has changed the way diplomacy is done
  Gold Surges Above Key EMAs, Bulls Eye Resistance Amidst Bullish Momentum
  AI Memory Boom Sparks Global Chip Supply Crunch
  China’s AI Manufacturing Boom Masks Weak Consumer Economy, Citi Says
  How AI prompting turned writerly description into an everyday skill
  With Iran and the US signing a peace deal, where does that leave Benjamin Netanyahu?
  Gold's 365-Day EMA Streak Since Oct 2023 Faces Its First Real Test at $3,980 — Break or Bounce to $4,140?
  Silver Cracks Key 365-Day EMA for First Time Since Feb 2024; Bears Eye $50 on Rallies


 - EconoTimes)


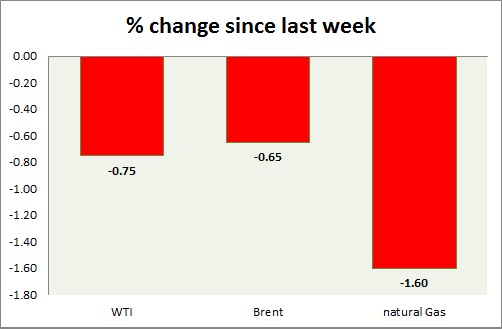
Energy pack is in red today. Weekly performance at a glance in chart & table.
Oil (WTI) -
- WTI is testing key level at $50/barrel.
- $54 area proved to be crucial resistance. Today's range $51.6-50.4
- WTI is likely to fall towards $42 area, once $50 support gets broken.
- WTI is currently trading at $50.4/barrel. Immediate support lies at $50 and resistance at $54
Oil (Brent) -
- Brent is treading water, supported by North Sea outage.
- Brent-WTI spread flat today, currently trading at $6.3/barrel.
- Target has reached around $55/barrel, and next target is around $51/barrel.
- Brent is trading at $56.7/barrel. Immediate support lies at $55 area and resistance at $59/60 region.
Natural Gas -
- Natural gas bulls retreated further after failing to clear resistance around $2.95/mmbtu area.
- A break above $2.95 area would push prices to first target of $3.1/mmbtu. However a failure would push prices lower.
- Bullish Doji, in weekly chart remains in focus. However resistance at $2.95 is quite strong.
- Natural Gas is currently trading at $2.83/mmbtu. Immediate support lies at $2.55, $2.45 area & resistance at $2.95, $3.04, $3.32.
|
WTI |
-0.75% |
|
Brent |
-0.65% |
|
Natural Gas |
-1.60% |


