


 FxWirePro: USD/JPY uptrend loses steam, remains on bullish path
  JPY Action Bias: Extremely Bullish Surge Ignites Across NZD, GBP & AUD
  FxWirePro- Major Crypto levels and bias summary
  FxWirePro: EUR/AUD outlook weaker on renewed downside pressure
  FxWirePro: USD/ZAR advances as South African rand weakens amid renewed Middle East tensions
  FxWirePro- Major Crypto levels and bias summary
  Major Pair Action Bias: Extremely Bullish Surge Powers GBPUSD & NZDUSD as Bullish Momentum Ignites
  ETH Stands Alone Bullish; BTC, SOL, XRP, BNB Neutral


 - EconoTimes)


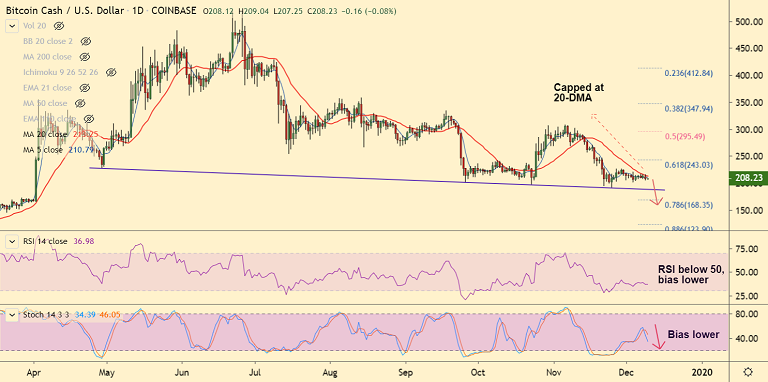
BCH/USD chart - Trading View
Exchange - Coinbase
Support: 201.90 (Lower BB); Resistance: 213.25 (20-DMA)
Technical Analysis: Bias bearish
BCH/USD was trading 0.54% lower at 207.27 at 08:30 GMT, after closing 2.03% lower in the previous session.
The pair is struggling to break past 20-DMA resistance from the past few sessions and technical indicator have turned bearish.
Stochs and RSI are biased lower and RSI is below 50 supporting the downtrend. Stochastics RSI is on verge of rollover from overbought levels.
Major and minor trend in the pair are bearish as depicted by the GMMA indicator. MACD and ADX also support downside.
The pair is on track to test major trendline support at 187. Violation at trendline will open further downside.


