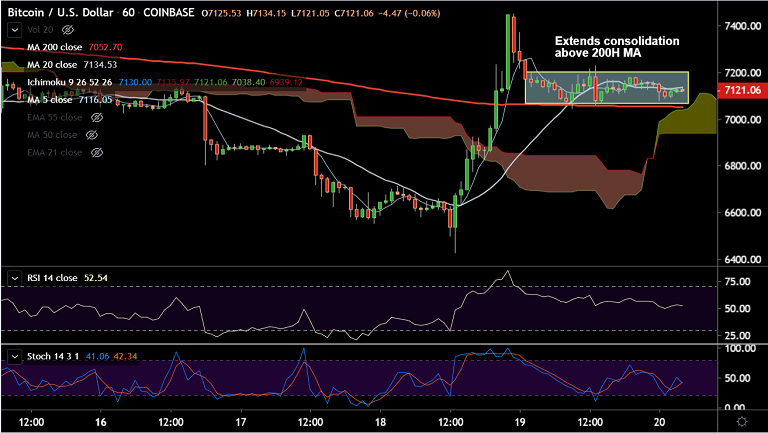
BTC/USD chart - Trading View
Exchange - Coinbase
Support: 7052 (200H MA); Resistance: 7265 (21-EMA)
Technical Analysis: Bias Bearish
BTC/USD has been extending sideways above 200H MA support (currently at 7052).
The pair is extending grind lower for the 2nd straight session, was trading at 7125 at 04:30 GMT, down 0.32% at the time of writing.
Upside lacks follow through, finds stiff resistance at 21-EMA at 7265, technical indicators also fail to support.
Major trend is strongly bearish. That said, rollover of oscillators from oversold could see minor upside continuation.
Breakout at 21-EMA could see near-term gains. Next major hurdle lies at 55-EMA at 7770.