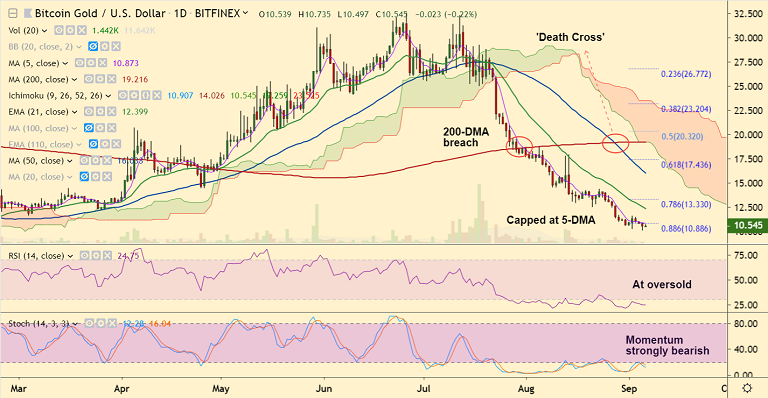
BTG/USD chart - Trading View
Exchange - Bitfinex
Support: 9.10 (Dec 7th 2018 low); Resistance: 12.402 (21-EMA)
Technical Analysis: Bias Bearish
Bitcoin Gold is extending weakness for the 8th straight week, hits 7-month lows at 10.115.
BTG/USD was trading at 10.490 at 09:30 GMT, down 0.74% at the time of writing.
Momentum strongly bearish. Oscillators are at oversold levels, but no signs of reversal seen.
'Death Cross' keeps downside pressure, volatility is rising as indicated by the expanding Bollinger bands.
Minor recovery attempts remain capped at 5-DMA. Scope for further downside. Next major support lies at 9.10 (Dec 2018 low).
Bullish divergence and oversold oscillators keeps scope for upside. Break above 21-EMA (12.394) will confirm near-term upside.



FxWirePro: USD/JPY slips as yen firms after hot Japan's wholesale inflation data
FxWirePro: EUR/NZD eases after hot US CPI data
FxWirePro: EUR/AUD scales one-week peak after ECB rate hike
FxWirePro: USD/CAD maintains bullish bias with focus on 1.4000
FxWirePro: EUR/NZD gaining momentum for a move towards 2.0100 level
FxWirePro- Major Crypto levels and bias summary
EUR/USD Defies ECB Rate Hike to Reclaim 1.1600: Technical Setup Points to Buy-on-Dips Opportunity
FxWirePro: USD/ZAR bearish again as upside bias reverses
FxWirePro- Major Crypto levels and bias summary
AUDJPY Trades in Narrow Range, Bearish Indicators Suggest Selling on Rallies
NZDJPY Consolidates, Resistance at 90.78 May Signal Favorability for Downtrend
EURUSD Holds Above 1.1600 Despite US CPI, Fed Rate Hike on the Horizon 


