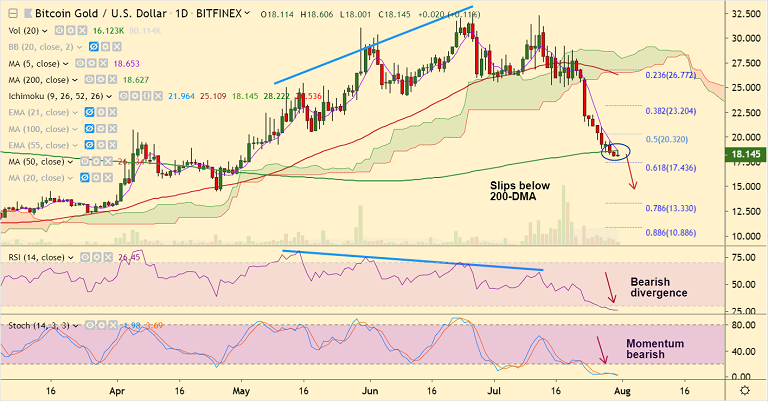
BTG/USD chart - Trading View
Exchange - Bitfinex
Support: 17.436 (61.8% Fib); Resistance: 18.627 (200-DMA)
Technical Analysis: Bias Bearish
Bitcoin Gold has slipped below 200-DMA, bias is strongly bearish.
Recovery attempts on 30th and 31st are capped below 200-DMA which is now offering strong resistance.
Price action has broken below 50W EMA. Technical indicators are highly bearish which suggest further downside.
Stochs and RSI on the weekly charts are sharply lower. RSI is well below 50 level.
That said, oscillators on the daily charts are into the oversold territory. Hence caution advised as the price may see minor pullback.
Major trend has definitely shifted to bearish as indicated by moves on the GMMA indicator.
Next immediate support lies at 61.8% Fib at 17.43 ahead of 14.46 (Apr 2019 lows).
Retrace above 200-DMA could see gains till 21-W EMA at 22.31. Break above negates near-term bearishness.
For details on FxWirePro's Currency Strength Index, visit http://www.fxwirepro.com/currencyindex.