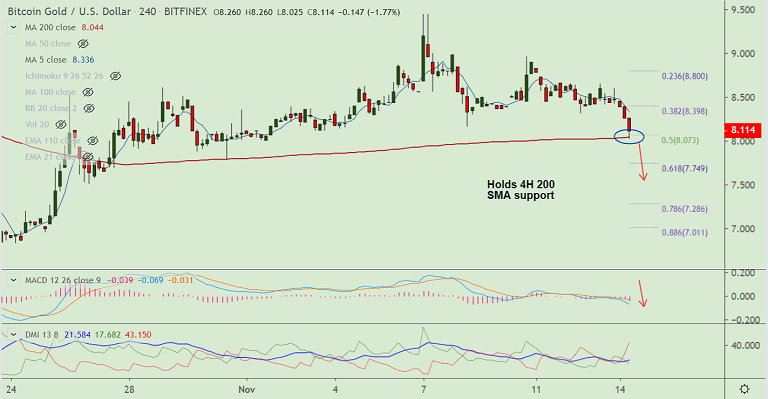
BTG/USD chart - Trading View
Exchange - Bitfinex
Support: 8.044 (4H 200 SMA); Resistance: 8.922 (55-EMA)
Technical Analysis: Bias turning bearish
BTG/USD was trading 4.22% lower on the day at 8.114 at 10:15 GMT, bias bearish.
The pair is extending weakness after failure to break above resistance at 55-EMA.
Price action has slipped below 21-EMA support (8.324). Technical studies support further weakness in the pair.
Stochs and RSI are sharply lower and RSI has slipped below the 50 mark. Volatility is rising on the intraday charts.
Price is holding support at 4H 200 SMA at 8.044. Break below will see drag lower. Next support aligns at 7.749 (61.8% Fib).
Immediate resistance is at 5-DMA at 8.504. Breakout at 55-EMA negates near-term bearish bias.