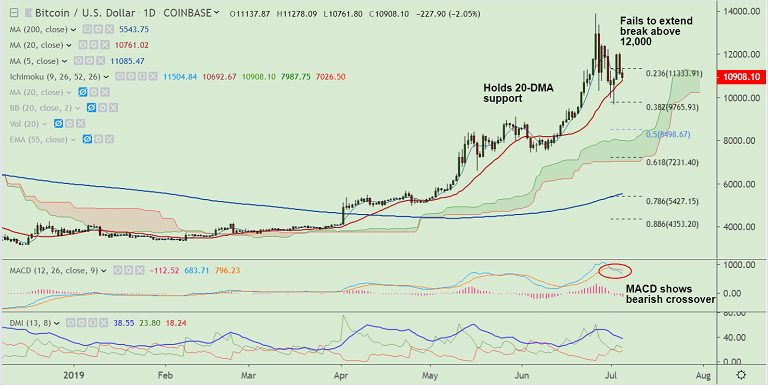
BTC/USD chart - Trading View
Exchange - Coinbase
Support: 10,761 (20-DMA); Resistance: 12,000
Technical Analysis: Bias turning slightly bearish
BTC/USD is extending weakness for the 2nd straight session.
Upside in the pair failed to hold gains above the $12,000 mark.
Price action slipped below $11,000 mark to test 20-DMA support at 10,761.
Volatility is rising on the intraday charts. Price action has broken below 200H SMA.
Major trend remains bullish, but technical indicators on the intraday charts are turning slightly bearish.
Break below 20-DMA could see minor weakness. While on the flipside, close above 12,000 could see upside resumption.
For details on FxWirePro's Currency Strength Index, visit http://www.fxwirepro.com/currencyindex.