


 FxWirePro: USD/CAD falls after BoC rate hold and weak U.S. producer inflation
  FxWirePro: EUR/AUD outlook weaker on renewed downside pressure
  GBPJPY Bullish on Consolidation: Holds Above 216 After 218 Top – Buy Dips at 217 Targeting 220
  FxWirePro- Major Pair levels and bias summary
  FxWirePro: GBP/NZD gains some upside momentum but still bearish
  NZDJPY Bullish Surge: Strong Kiwi Ignites Fresh Upside as 94 Support Holds and All EMAs Align
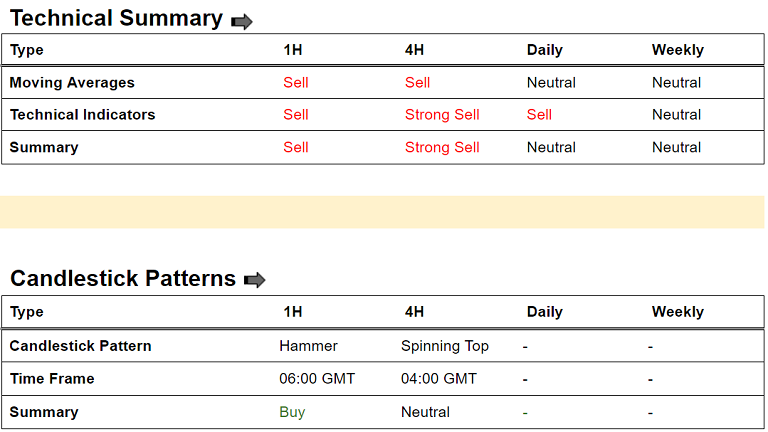
  Crypto Major Pair Action Bias: ETHUSD Bullish as BTCUSD, SOLUSD & XRPUSD Stay Neutral
  FxWirePro: USD/JPY uptrend loses steam, remains on bullish path
  FxWirePro: AUD/USD edges lower, but bullish outlook persists


ETH/USD chart - Trading View
Exchange - Coinbase
Major Support Levels:
S1: 207.41 (200-DMA)
S2: 200.96 (55-EMA)
S3: 198.26 (21-EMA)
Major Resistance Levels:
R1: 214.80 (5-DMA)
R2: 226.75 (100-DMA)
R3: 240.2 (38.2% Fib)
Summary: ETH/USD retraces from 6-week highs at 224.71 and is currently hovering around 200-DMA support at 207.41. Break below 200-DMA will see further weakness. Technical indicators on the intraday are turning bearish. Stochs and RSI are on verge of rollover from overbought levels. Major trend is bearish, break below 200-DMA will drag the pair lower. Bullish divergence could limit downside.
Guidance: Stay short on break below 200-DMA, target-1: 200, target-2: 198.50


