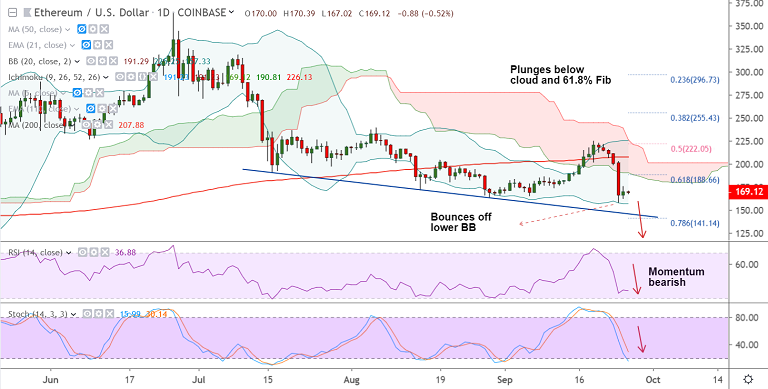
ETH/USD chart - Trading View
Exchange - Coinbase
Support: 145.75 (Trendline); Resistance: 183.44 (5-DMA)
Technical Analysis: Bias Bearish
ETH/USD is trading largely rangebound, with session highs at 170.39 and lows at 167.02.
The pair has bounced off lower Bollinger band support on Wednesday's trade, bias remains bearish.
A 'Spinning Top' formation on Wednesday's daily candle suggests consolidation likely to extend.
Recovery seems to find stiff resistance at 2H 20-SMA. 'Inverted Hammer' formed (20:00 GMT 25th) on the 4H charts.
'Death cross' (bearish 50-DMA crossover on 200-DMA) on the 2H charts adds to the bearish bias.
Resumption of weakness will see test of trendline support at 145.75 ahead of 78.6% Fib at 141.14.
Break above 2H 20-SMA could see gains upto 2H 21-EMA at 173.97. Break above 55H EMA at 177.43 to confirm near-term upside.