


 GBPUSD, AUDUSD & NZDUSD Turn Extremely Bullish: Strong Positive Momentum Drives Major Pair Action Bias
  Gold Loses Steam After Strong U.S. Retail Sales
  FxWirePro- Major Crypto levels and bias summary
  JPY Action Bias: Extremely Bullish Surge Ignites Across NZD, GBP & AUD
  FxWirePro: AUD/USD remains buoyant, looks to extend gains
  FxWirePro- Woodies pivot (Major)
  FxWirePro- Woodies pivot (Major)
  Crypto Major Pair Action Bias: ETHUSD Bullish as BTCUSD, SOLUSD & XRPUSD Stay Neutral
  ETHUSD Bullish Momentum: Follows BTC Above All EMAs, Buy Dips Near $1750 Targeting $2300


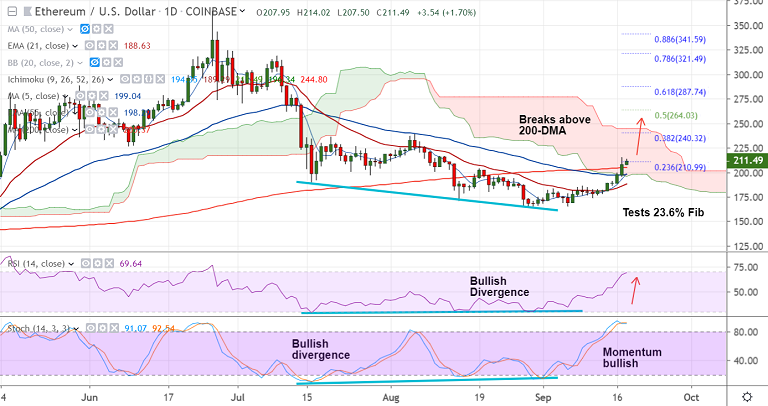
ETH/USD chart - Trading View
Exchange - Coinbase
Support: 207.55 (55-EMA); Resistance: 228.70 (110W EMA)
Technical Analysis: Bias Bullish
ETH/USD was trading 2.10% higher on the day at 212.27 at 03:00 GMT.
The pair has shown a break above 200-DMA resistance to hit 5-week highs at 215.
Bias is bullish and could take the pair to further highs. Next major resistance lies at 228.70 (110W EMA).
That said, oscillators are at overbought levels raising chance for some correction. However, no signs of reversal seen.
200-DMA is now strong support at 205.37. Break below might see weakness till 55-EMA at 198.30. Bullish invalidation only below 21-EMA.


