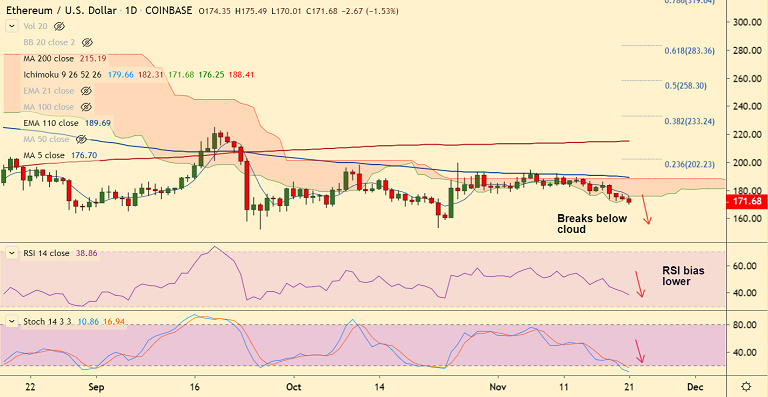
ETH/USD chart - Trading View
Exchange - Coinbase
Support: 154.55 (Trendline); Resistance: 176.25 (Cloud base)
Technical Analysis: Bias bearish
ETH/USD extends weakness for the 4th straight session, scope for further downside.
The pair has ended the consolidation phase, bias has turned bearish after failure to break 21W EMA resistance.
Price action has dropped below daily cloud and upside is capped at 5-DMA at 176.69.
The pair was trading 1.56% lower at 171.63 at 09:15 GMT after closing 0.79% lower in the previous session.
Technical studies are strongly bearish, Stochs and RSI are biased lower and RSI has fallen below 50 mark.
Major and near-term trend have shifted to bearish as shown by the GMMA indicator. MACD and ADX also support weakness.
Dip till next major support at 154.55 (Trendline) likely. Immediate resistance lies at 5-DMA at 176.25. Break above 110-EMA (189.69) will negate near-term bearish bias.