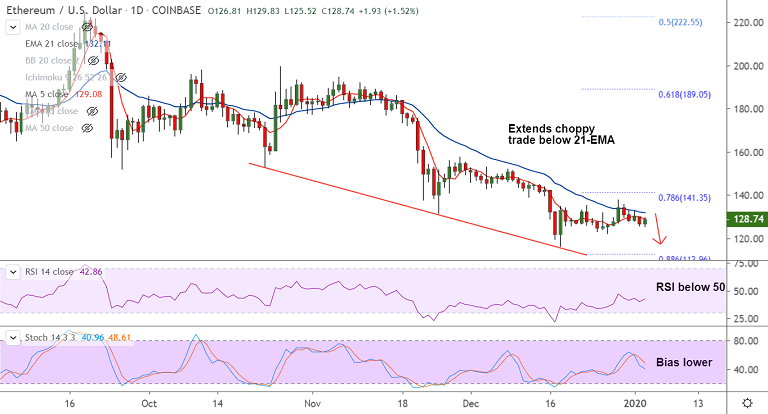
ETH/USD chart - Trading View
Exchange - Coinbase
Support: 120.88 (Lower BB); Resistance: 132.11 (21-EMA)
Technical Analysis: Bias Bearish
ETH/USD was trading at 128.66, up 1.46% at 05:25 GMT, after closing 2.60% lower in the previous session.
The pair has been extending choppy trade below 21-EMA, recovery attempts remain capped below 200H MA.
Technical indicators support weakness. RSI below 50 and Stochs are biased lower. Stochastics RSI shows rollover from overbought levels.
Major trend has been bearish and resumption of weakness will see dip till lower BB at 120.88. Break below eyes 88.6% Fib at 112.96.
Immediate resistance is seen at 5-DMA at 129.11. Break above 21-EMA at 132.14 could change near-term dynamics.



FxWirePro- Major Crypto levels and bias summary
FxWirePro: GBP/USD edged higher as hopes for US-Iran deal boost riskier assets
FxWirePro: GBP/NZD slide extends ,eyes 2.2600 level
FxWirePro- Major Pair levels and bias summary
Ether Breaks Below $2,100: Triple EMA “Sell-the-Rally” Setup Targets $1,900
FxWirePro: USD/CNY bears maintain upper hand
Bitcoin Bleeds $704M in ETF Outflows as Institutional Exodus Accelerates
Bitcoin Cracks $75K as $1.3B ETF Exodus and Middle East Jitters Spook Bulls; Bears Eye $70K
FxWirePro: EUR/ NZD dips below lower range, bearish bias increases
FxWirePro: EUR/AUD downward momentum remains in place
EUR/JPY Bulls Hold the Line Above 185: Eyes Locked on 188 Breakout
Ethereum Tumbles Below $2K: Bears Eye $1,700 as All Key EMAs Flip Red
FxWirePro- Major Pair levels and bias summary 


