


 Crypto Major Pair Action Bias: ETHUSD Bullish as BTCUSD, SOLUSD & XRPUSD Stay Neutral
  FxWirePro: GBP/NZD downtrend loses steam, remains on bearish path
  FxWirePro- Major Crypto levels and bias summary
  FxWirePro: USD/ZAR advances as South African rand weakens amid renewed Middle East tensions
  FxWirePro- Major Crypto levels and bias summary
  FxWirePro: GBP/NZD gains some upside momentum but still bearish
  JPY Action Bias: Extremely Bullish Surge Ignites Across NZD, GBP & AUD
  EUR/USD Holds Bullish Tone Despite Pullback from Yesterday’s High
  FxWirePro- Woodies pivot (Major)
  FxWirePro:EUR/NZD stuck In narrow ranges, focus on near term support
  NZDJPY Bullish Surge: Strong Kiwi Ignites Fresh Upside as 94 Support Holds and All EMAs Align
  ETH Stands Alone Bullish; BTC, SOL, XRP, BNB Neutral
  FxWirePro- Major Pair levels and bias summary
  Major Pair Action Bias: Extremely Bullish Surge Powers GBPUSD & NZDUSD as Bullish Momentum Ignites


, decisive break below to see downside resumption - EconoTimes)


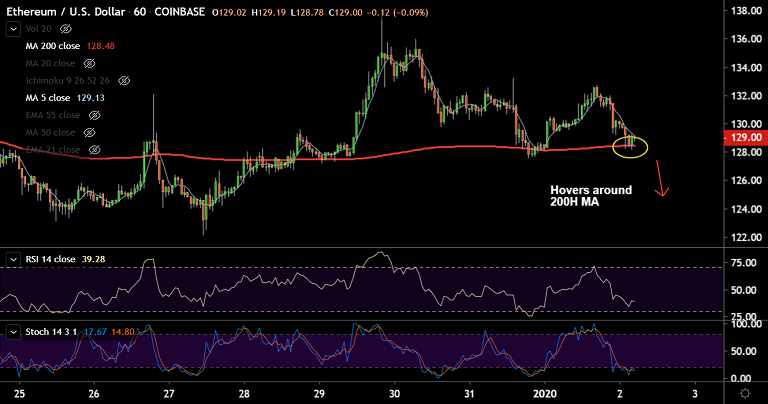
ETH/USD chart - Trading View
Exchange - Coinbase
Support: 128.48 (200H MA); Resistance: 132.64 (21-EMA)
Technical Analysis: Bias Bearish
ETH/USD was trading 0.96% lower on the day at 128.94 at 05:15 GMT after closing 1.28% higher in the previous session.
The pair has failed to hold break above 21-EMA which offers stiff resistance at 132.64.
Major trend in the pair is bearish and failure at 21-EMA has dented scope for further recovery.
Technical indicators support weakness. RSI below 50 and Stochs are biased lower lower. Stochastics RSI is on verge of rollover from overbought levels.
Price action hovers around 200H MA (128.48). Decisive break below will see resumption of weakness.
Next major support lies at lower BB at 120.13. Break below eyes 88.6% Fib at 112.96. Immediate resistance is seen at 21-EMA at 132.64. Break above could see near term upside.


