


 AUDJPY Bullish Surge: Strong Australian Dollar Fuels Fresh Upside as Pair Holds Above 113.50 and All EMAs Align
  FxWirePro: NZD/USD trades in narrow range ,outlook bullish
  Gold Loses Steam After Strong U.S. Retail Sales
  Crypto Major Pair Action Bias: ETHUSD Bullish as BTCUSD, SOLUSD & XRPUSD Stay Neutral
  Major Pair Action Bias: Extremely Bullish Surge Powers GBPUSD & NZDUSD as Bullish Momentum Ignites
  EUR/USD Holds Bullish Tone Despite Pullback from Yesterday’s High
  FxWirePro: AUD/USD edges lower, but bullish outlook persists
  ETH Stands Alone Bullish; BTC, SOL, XRP, BNB Neutral
  AUDJPY Extremely Bullish Above 113: Strong AUD Fuels Fresh Rally – Buy Dips at 113 Targeting 115


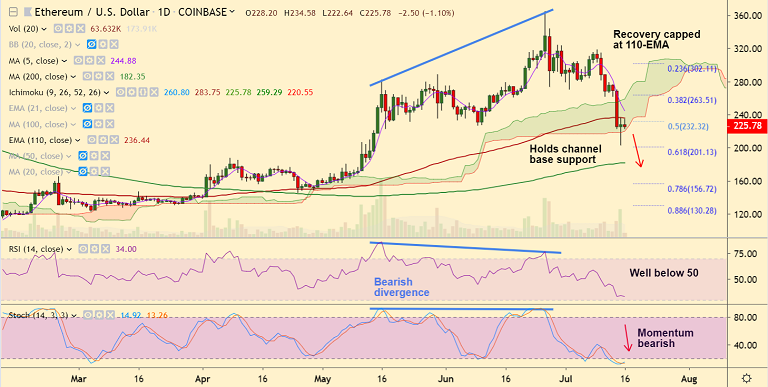
ETH/USD chart - Trading View
Exchange - Coinbase
Support: 201.13 (61.8% Fib); Resistance: 236.44 (110-EMA)
Technical Analysis: Bias Bearish
ETH/USD consolidates break below 110-EMA, bias remains bearish.
RSI is well below 50 and momentum studies are bearish. 'Doji' formation at lows suggests some consolidation before the next leg lower.
The pair has edged off from 2-month lows at 203 and cloud is offering strong support.
Recovery attempts seem to be capped at 110-EMA, retrace above could see further gains.
Price has slipped below major moving averages and volatility is rising.
Test of 61.8% Fib at 201.13 on cards. Further weakness raises scope for test of 200-DMA at 182.35.
For details on FxWirePro's Currency Strength Index, visit http://www.fxwirepro.com/currencyindex.


