


 Crypto Major Pair Action Bias: ETHUSD Bullish as BTCUSD, SOLUSD & XRPUSD Stay Neutral
  Major Pair Action Bias: Extremely Bullish Surge Powers GBPUSD & NZDUSD as Bullish Momentum Ignites
  NZDJPY Bullish Surge: Strong Kiwi Ignites Fresh Upside as 94 Support Holds and All EMAs Align
  FxWirePro: GBP/USD hits one-month high, scope for further upside
  FxWirePro: GBP/NZD gains some upside momentum but still bearish
  FxWirePro- Woodies pivot (Major)
  GBPJPY Bullish on Consolidation: Holds Above 216 After 218 Top – Buy Dips at 217 Targeting 220


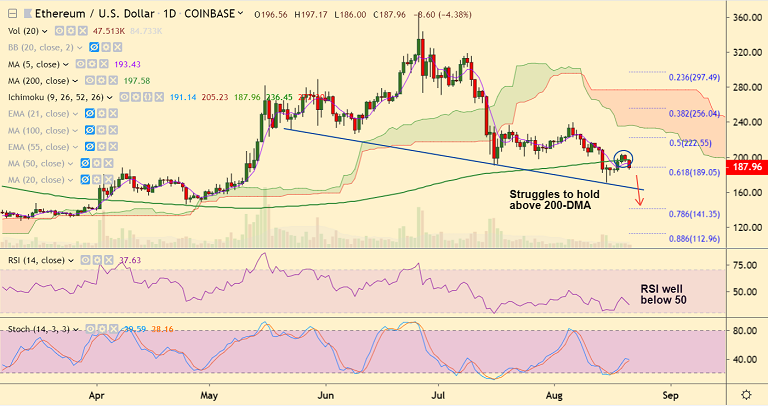
ETH/USD chart - Trading View
Exchange - Coinbase
Support: 171 (Aug 15 low); Resistance: 197.58 (200-DMA)
Technical Analysis: Bias Bearish
ETH/USD extends weakness for the 2nd straight session, bias turning bearish.
The pair has failed to extend gains above $200 mark, slips lower.
Major trend is bearish as shown by GMMA indicator. Parabolic SAR also supports weakness.
Price has slipped below 200-DMA and 200 SMA on the hourly charts. Hovers around 61.8% Fib.
RSI and Stochs are now biased lower. Volatility rising on the intraday charts.
Break below 61.8% Fib (189.05) will see dip till 171 (Aug 15 low) ahead of 165.75 (trendline).
200-DMA is now major resistance at 197.58. Retrace above will see further consolidation.


