


 FxWirePro :USD/JPY bulls loosen their grip a bit, dips to be bought
  FxWirePro: USD/CAD falls after BoC rate hold and weak U.S. producer inflation
  EUR/USD Holds Bullish Tone Despite Pullback from Yesterday’s High
  Crypto Major Pair Action Bias: ETHUSD Bullish as BTCUSD, SOLUSD & XRPUSD Stay Neutral
  ETHUSD Bullish Momentum: Follows BTC Above All EMAs, Buy Dips Near $1750 Targeting $2300
  FxWirePro- Major Crypto levels and bias summary
  FxWirePro:EUR/NZD dips below lower range, bearish bias increases
  FxWirePro: EUR/AUD outlook weaker on renewed downside pressure
  FxWirePro: NZD/USD trades in narrow range ,outlook bullish
  FxWirePro: USD/JPY uptrend loses steam, remains on bullish path
  FxWirePro- Major Crypto levels and bias summary
  NZDJPY Bullish Surge: Strong Kiwi Ignites Fresh Upside as 94 Support Holds and All EMAs Align


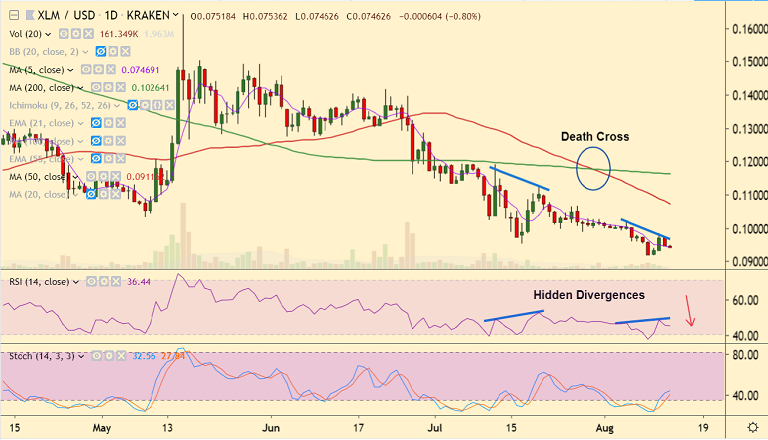
XLM/USD chart - Trading View
Exchange - Kraken
Support: 0.0665 (Feb 6 low); Resistance: 0.0808 (21-EMA)
Technical Analysis: Bias Bearish
Stellar Lumens set to extend weakness. Hidden 'Bearish Divergence' to support more downside.
XLM/USD trades extremely range-bound on the day with session highs at 0.0753 and lows at 0.0744.
Major trend in the pair is bearish as indicated by GMMA indicator.
Further, formation of 'Death Cross' (bearish 50-DMA crossover on 100-DMA) adds to the downside bias.
Recovery attempts lack traction. Price has failed to extend break above 200H SMA.
Scope for test of next major support at 0.0665 (Feb 6 low). Break above 21-EMA (0.0808) will see minor upside.


