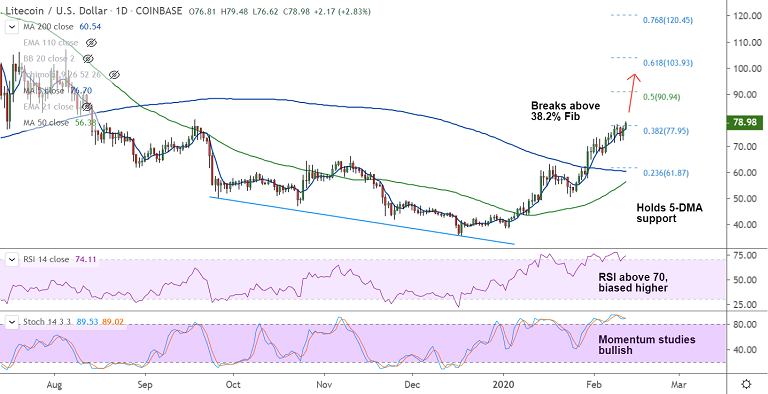
LTC/USD chart - Trading View
Exchange - Coinbase
Technical Analysis: Bias Bullish
GMMA Indicator: Major Trend - Bullish; Minor Trend - Bullish
Overbought/ Oversold Index: Overbought
Volatility: High and rising
Support: 77.95 (38.2% Fib); Resistance: 84.09 (weekly cloud)
LTC/USD correction has held above 200H MA support, bias remains bullish.
The pair has broken above 38.2% Fib at 77.95 and trades shy of $80 mark.
Price action is on track to close in the green for the 3rd straight week, $100 levels in sight.
Momentum strongly bullish. Minor correction can be used to accumulate for long term.
Next major hurdle lies at weekly cloud at 84.09. Break above see little resistance till 50% Fib at 90.94.
5-DMA is immediate support at 76.70. Bullish invalidation only below 200-DMA.