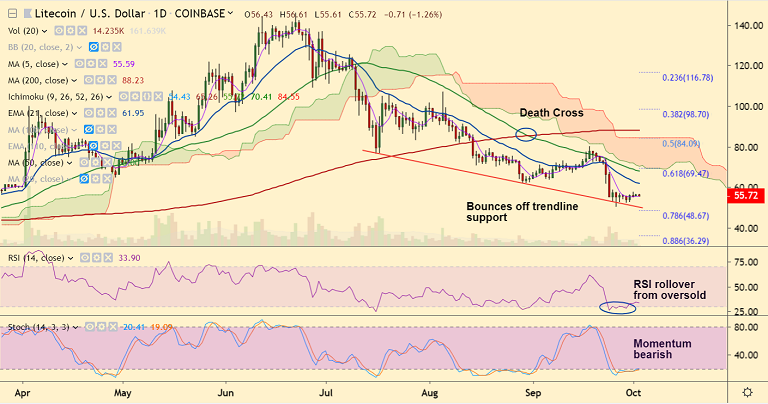
LTC/USD chart - Trading View
Exchange - Coinbase
Support: 55.42 (200H SMA); Resistance: 61.96 (21-EMA)
Technical Analysis: Bias Neutral
LTC/USD stuck in narrow range trades directionless above 5-DMA support.
Major trend in the pair remains bearish, no change in bias seen on the daily charts.
On the hourly charts, the pair has broken above 200H SMA, raising scope for some upside.
No support from technical indicators as of now for further upside, bias remains neutral.
Oversold oscillators, bounce off trendline support and bullish divergence raises scope for some upside.
Immediate resistance is seen at 3H 55 EMA at 56.87. Breakout with rising volatility could see upside. Next major hurdle lies at 21-EMA at 61.95.
Immediate support lies at 5-DMA at 55.59. Close below could see retrace till trendline support at 50.25.