


 FxWirePro- Major Crypto levels and bias summary
  FxWirePro: USD/JPY uptrend loses steam, remains on bullish path
  Crypto Major Pair Action Bias: ETHUSD Bullish as BTCUSD, SOLUSD & XRPUSD Stay Neutral
  FxWirePro- Major Crypto levels and bias summary
  FxWirePro: USD/CAD falls after BoC rate hold and weak U.S. producer inflation
  GBPUSD, AUDUSD & NZDUSD Turn Extremely Bullish: Strong Positive Momentum Drives Major Pair Action Bias
  FxWirePro- Woodies pivot (Major)
  GBPJPY Bullish Surge: Strong Pound Ignites Fresh Upside on Fed-BOE Policy Divergence as All EMAs Align
  AUDJPY Bullish Surge: Strong Australian Dollar Fuels Fresh Upside as Pair Holds Above 113.50 and All EMAs Align


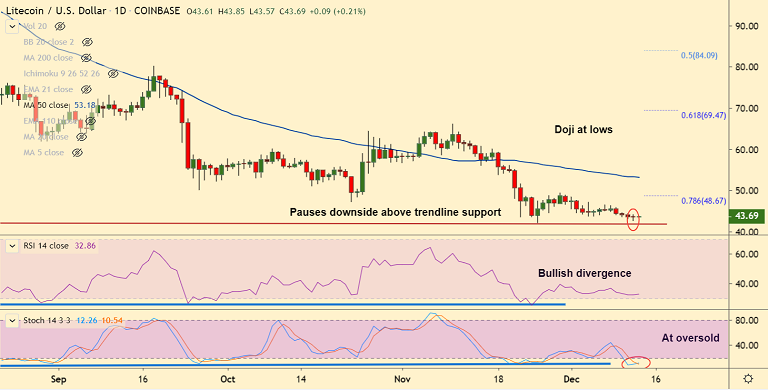
LTC/USD chart - Trading View
Exchange - Coinbase
Support: 41.85 (Trendline); Resistance: 44.60 (200H MA)
Technical Analysis: Bias Neutral to slightly Bullish
LTC/USD is flashing signs of nascent recovery, trades 0.23% higher at 43.70 at 06:40 GMT.
The pair has been extending sideways grind since Nov 25th and major trend remains bearish.
Price action has held above trendline support (currently at 41.85) and extension on weakness only on break below.
After erasing around 70% of its value since highs of 146 seen in June 2019, the pair shows signs of minor recovery.
'Dragonfly Doji' at lows together with bullish RSI and Stochs divergence on daily and intraday charts raises scope for gains.
That said, 200H MA is major resistance (currently at 44.60). Break above will confirm near-term upside.
Failure to break above 200H MA and breach below trendline support (41.85) will open downside for the pair. Next major support lies at 36.29 (88.6% Fib).


