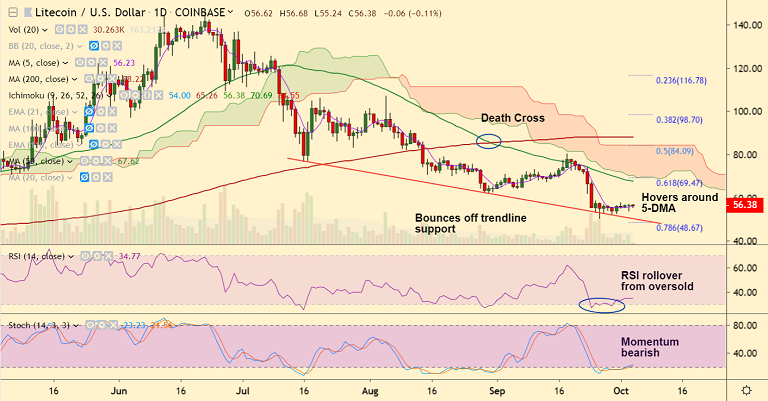
LTC/USD chart - Trading View
Exchange - Coinbase
Support: 55.37 (200H SMA); Resistance: 61.51 (21-EMA)
Technical Analysis: Bias Bearish
LTC/USD is holding above 200H SMA support at 55.37, break below will see resumption of weakness.
Major trend in the pair is bearish as confirmed by GMMA indicator. Intraday bias remains neutral.
Price action is below cloud and major moving averages. MACD is in the negative territory and -ve DMI is dominating.
'Death Cross' (bearish 50-DMA crossover on 200-DMA) keeps downside pressure.
Price action has been rejected at 55W EMA and volatility is rising on the weekly charts.
Break below 200H SMA will see weakness till 50.00 (trendline support) ahead of 48.67 (78.6% Fib).
On the flipside, decisive breakout above 21-EMA will take the pair higher to test 55-EMA at 70.26.