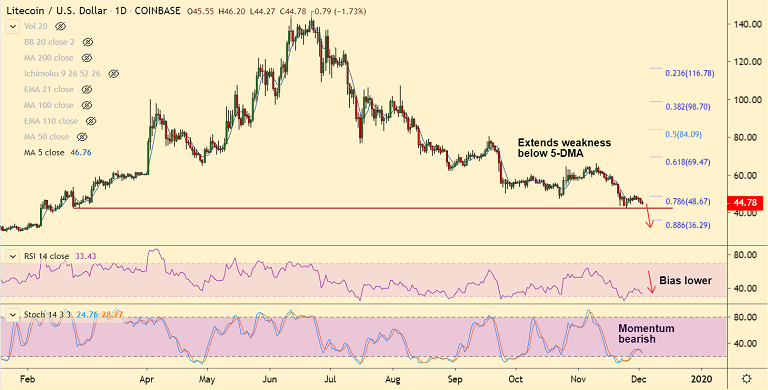
LTC/USD chart - Trading View
Exchange - Coinbase
Support: 42.00 (Trendline); Resistance: 46.77 (5-DMA)
Technical Analysis: Bias bearish
Litecoin has been on a downward spiral since June 2019 and the pair still remains in a strong bear grip.
The pair has faded recovery attempts and has resumed weakness, scope for test of fresh multi-month lows.
LTC/USD was trading at 44.81, down 1.73% at 10:55 GMT after closing 4.06% lower in the previous session.
Major trend has been bearish. Technical indicators support weakness. Near-term trend also has turned bearish.
Next bear target lies at 42.00 (Trendline). Break below will see dip till 88.6% Fib at 36.29.



Ether Breaks Below $2,100: Triple EMA “Sell-the-Rally” Setup Targets $1,900
FxWirePro: GBP/USD edged higher as hopes for US-Iran deal boost riskier assets
FxWirePro: USD/CNY bears maintain upper hand
Bitcoin Buckles at $73,500: Middle East Tensions and Weak Institutional Demand Set Bearish EMA Stack on $70K Collision Course
Aussie Yen Breaks 114 Barrier: Bulls Lock Horns With Resistance, Eyes on 115 Summit
FxWirePro: USD/ZAR sell bias remains below key resistance zone
Bitcoin Bleeds $704M in ETF Outflows as Institutional Exodus Accelerates
Bitcoin Cracks $75K as $1.3B ETF Exodus and Middle East Jitters Spook Bulls; Bears Eye $70K
FxWirePro: GBP/NZD slide extends ,eyes 2.2600 level
FxWirePro: GBP/AUD downside pressure builds, key support level in focus 


