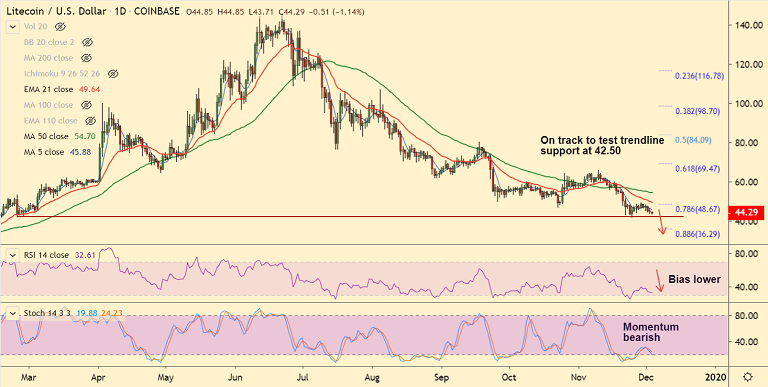
LTC/USD chart - Trading View
Exchange - Coinbase
Support: 42.50 (Trendline); Resistance: 45.89 (5-DMA)
Technical Analysis: Bias bearish
Litecoin continues to extend weakness for the 3rd straight session amidst strong bear grip.
The pair was trading at 44.28, down 1.16% at 07:15 GMT after closing 1.69% lower in the previous session.
LTC/USD has been on a downward spiral since June 2019, scope for test of fresh multi-month lows.
Technical indicators support weakness. 5-DMA has turned, Stochs and RSI are biased lower.
Major and minor trend as depicted by the GMMA indicator have turned bearish. RSI and Stochs converge with price action.
The pair is on track to test trendline support at 42.50. Break below finds little support till 36.29 (88.6% Fib).