


 FxWirePro :USD/JPY bulls loosen their grip a bit, dips to be bought
  FxWirePro- Major Crypto levels and bias summary
  AUDJPY Bullish Surge: Strong Australian Dollar Fuels Fresh Upside as Pair Holds Above 113.50 and All EMAs Align
  ETH Stands Alone Bullish; BTC, SOL, XRP, BNB Neutral
  Major Pair Action Bias: Extremely Bullish Surge Powers GBPUSD & NZDUSD as Bullish Momentum Ignites
  FxWirePro: EUR/AUD outlook weaker on renewed downside pressure
  GBPUSD, AUDUSD & NZDUSD Turn Extremely Bullish: Strong Positive Momentum Drives Major Pair Action Bias
  FxWirePro: NZD/USD steadies around 0.5830,retains bid tone
  FxWirePro: NZD/USD trades in narrow range ,outlook bullish


 halts upside with 'Doji', 'Death Cross' to trigger downside - EconoTimes)


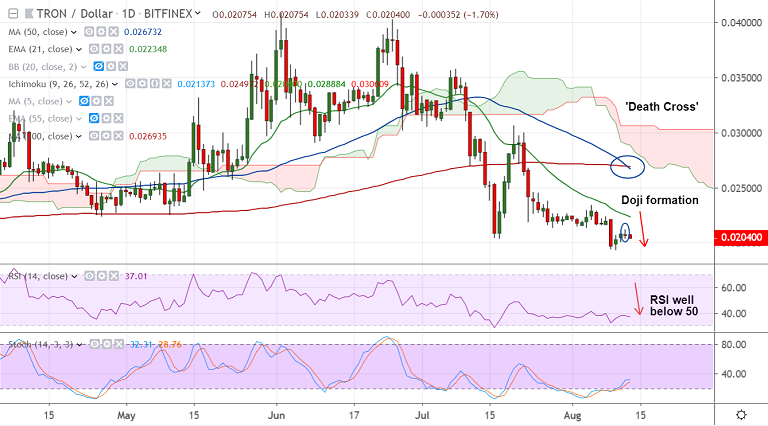
TRX/USD chart - Trading View
Exchange - Bitfinex
Support: 0.0199 (Lower BB); Resistance: 0.0217 (20-DMA)
Technical Analysis: Bias Bearish
TRX/USD has paused upside with a 'Doji' formation on the previous day's chart.
The pair was trading 2.18% lower on the day at 0.0203 at 06:10 GMT, bias is bearish.
A 'Death Cross' (bearish 50-DMA crossover on 200-DMA) confirmed on the daily charts to plummet prices.
Further the pair has broken strong trendline support at 0.0213, adding to the downside bias.
GMMA shows major trend in the pair is bearish. The parabolic SAR also shows downside for the pair.
Immediate support is seen at lower BB (weekly at 0.0175) ahead of 0.0160 (Aug 2018 low).
20-DMA is immediate resistance at 0.0217. Bearish invalidation only above 200-DMA (0.0269)


