


 FxWirePro: USD/JPY uptrend loses steam, remains on bullish path
  Gold Loses Steam After Strong U.S. Retail Sales
  FxWirePro- Major Crypto levels and bias summary
  FxWirePro: USD/CAD falls after BoC rate hold and weak U.S. producer inflation
  FxWirePro:EUR/NZD dips below lower range, bearish bias increases
  FxWirePro- Major Pair levels and bias summary
  FxWirePro: GBP/NZD gains some upside momentum but still bearish
  AUDJPY Bullish Surge: Strong Australian Dollar Fuels Fresh Upside as Pair Holds Above 113.50 and All EMAs Align


 shows minor retracement from 12-week high (0.0230), 200-DMA offers stiff resistance - EconoTimes)


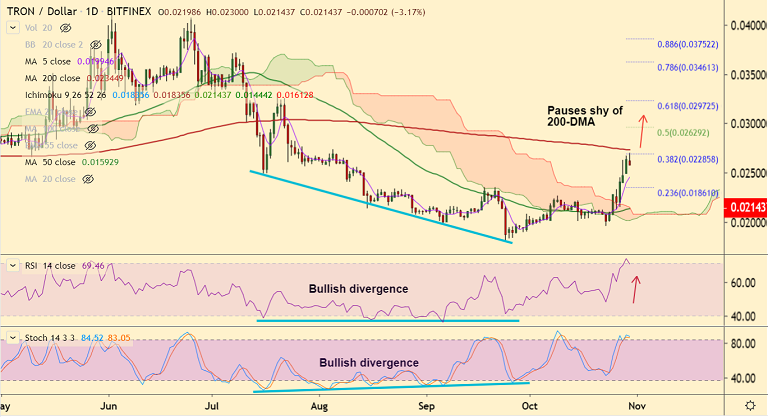
TRX/USD chart - Trading View
Exchange - Bitfinex
Support: 0.019946 (5-DMA); Resistance: 0.02345 (200-DMA)
Technical Analysis: Bias bullish
TRX/USD has paused bullish run just short of 200-DMA resistance at 0.023449.
The pair hit new 12-week highs at 0.0230 before paring some gains to trade at 0.021437 at 05:20 GMT.
GMMA shows shift in near-term bias to bullish. The short-term MAs have shown a break above long-term MAs.
Breakout above 110-EMA and daily cloud further strengthens bullish bias. Volatility is also rising on the daily charts.
200-DMA offers stiff resistance. Some consolidation at current levels likely. Break above 200-DMA will see upside resumption.
Next bull target lies at 55W EMA at 0.025639 ahead of 50% Fib retracement at 0.026292.
Immediate support lies at 5-DMA at 0.019946. Retrace below 110-EMA and daily cloud negates bullish bias.


