


 Gold Loses Steam After Strong U.S. Retail Sales
  FxWirePro: GBP/NZD gains some upside momentum but still bearish
  FxWirePro: NZD/USD steadies around 0.5830,retains bid tone
  FxWirePro- Major Pair levels and bias summary
  FxWirePro: AUD/USD edges lower, but bullish outlook persists
  FxWirePro: EUR/AUD outlook weaker on renewed downside pressure
  FxWirePro: GBP/USD hits one-month high, scope for further upside
  NZDJPY Bullish Surge: Strong Kiwi Ignites Fresh Upside as 94 Support Holds and All EMAs Align
  FxWirePro: AUD/USD remains buoyant, looks to extend gains
  FxWirePro :USD/JPY bulls loosen their grip a bit, dips to be bought


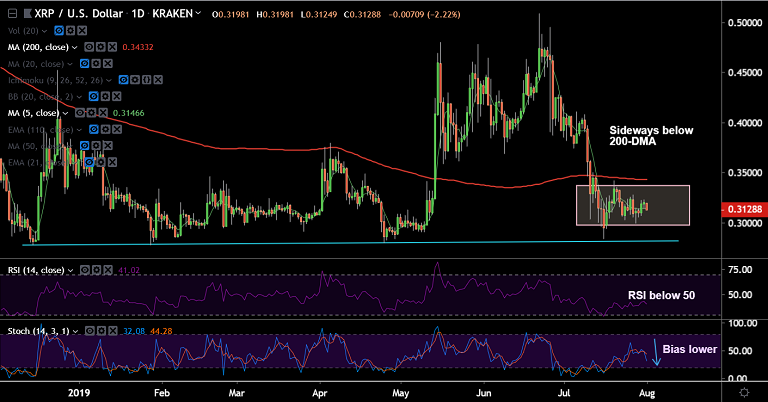
XRP/USD chart - Trading View
Exchange - Kraken
Support: 0.2990 (Lower BB); Resistance: 0.3276 (21-EMA)
Technical Analysis: Bias Bearish
XRP/USD is extending sideways grind, major trend remains bearish.
The pair was trading 2.33% lower on the day at 0.3125 at 10:00 GMT.
GMMA has shown a shift in trend to bearish with both short and long term moving averages pointing south.
RSI is well below 50 levels and Stochs have turned south, scope for further weakness.
Upside was capped at weekly cloud and price has has retraced below major moving averages.
Bias remains bearish as long as pair holds 200-DMA resistance. Breakout could change dynamics for the pair.
Near-term bias is bearish. Scope for test of 0.2820 (trendline support). Further weakness only on break below.
For details on FxWirePro's Currency Strength Index, visit http://www.fxwirepro.com/currencyindex.


