XRP/USD chart - Trading View
Exchange - Kraken
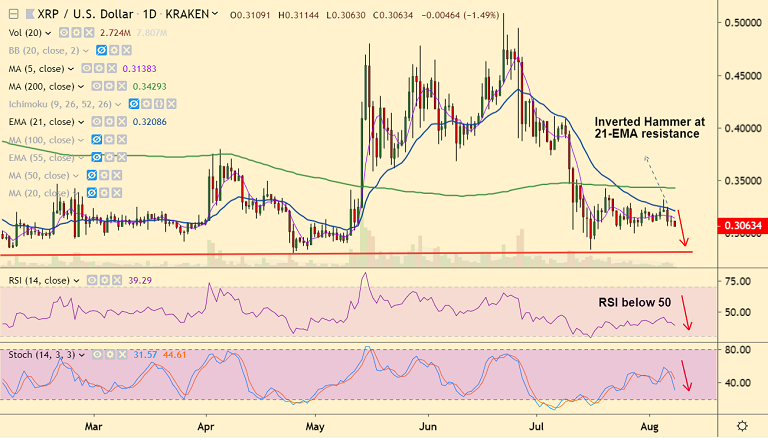
Support: 0.2820 (Trendline); Resistance: 0.3202 (21-EMA)
Technical Analysis: Bias Bearish
XRP/USD is extending weakness below 5-DMA, scope for further downside.
The pair has resumed weakness after 'Doji' formation on previous days' candle.
Price was down 1.06% at 0.3076 at 07:00 GMT, 'Inverted Hammer' at 21-EMA resistance to plummet prices further.
Price action below major moving averages and daily cloud, 5-DMA is also showing a slight turn lower.
RSI is below 50. Stochs are biased lower and GMMA shows major trend has shifted to bearish.
Stochastics RSI shows rollover into neutral. Volatility rising on the intraday charts.
Scope for prices to fall. Next major support lies at trendline at 0.2820.
21-EMA is major resistance at 0.3202. Break above 200-DMA (0.3429) could negate near-term bearishness.